Overview
GDAnalyzer is an alternative to the official free test programs for Microchip maXTouch touch controllers. It covers the whole production-line flow — firmware programming, configuration loading, hardware tests, sensor tests and operator-interactive integration tests — in one tool, driving the chip directly over HID/I2C through bridge fixtures such as the D21, USB5030 (QRG-I/F) and the 5055 measurement board.
The Problem with the Official Free Tools
The official free test programs work, but handing them over to a production line or a supplier has two long-standing drawbacks:
| Drawback | What actually happens |
|---|---|
| Loose-file delivery | The chip tuning configuration has to be shipped as separate files sitting next to the test program. The line or the supplier receives a scattered folder of files; zipping them up helps, but it is still far from an ideal deliverable. |
| Tuning data leakage | Those loose configuration files contain the chip tuning — the core of the RD team's know-how — and the supplier is often a competitor of the RD company itself. Common workarounds are shipping a different version or a deliberately simplified tuning file, which weakens the test quality, and even then the supplier can still read the tuning design and potentially copy the technology. |
The Answer: Export Line Tool
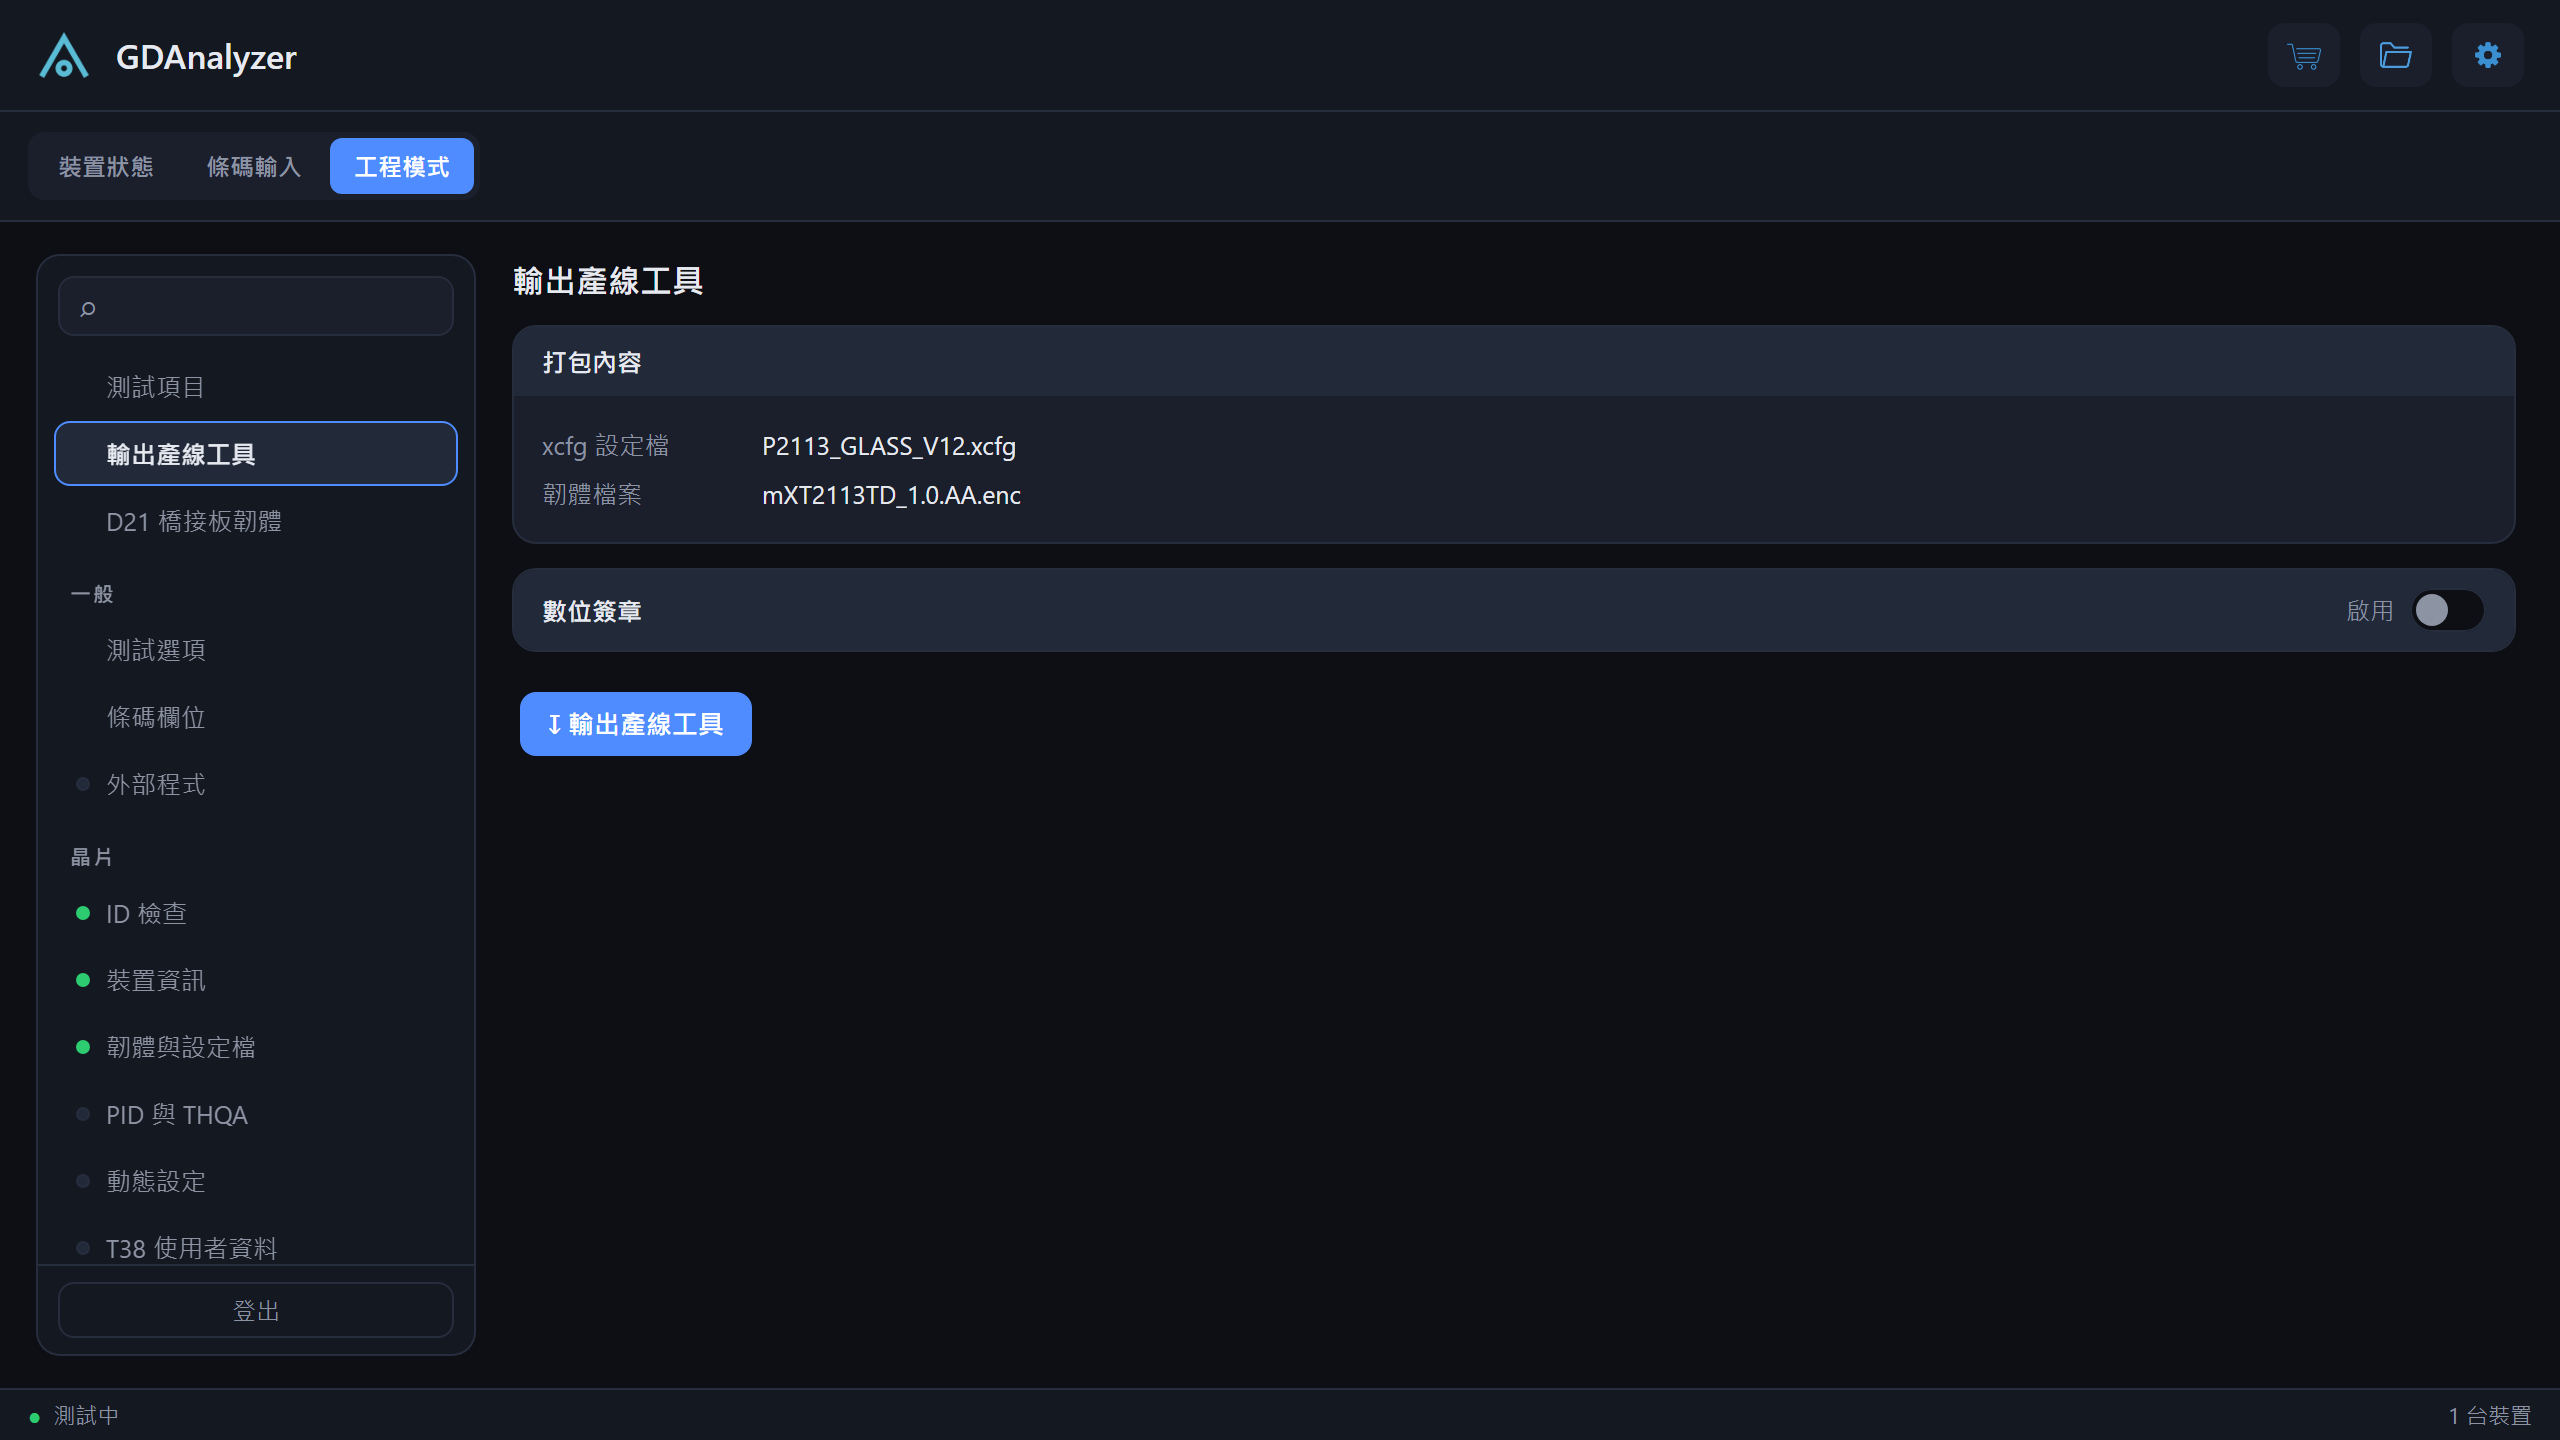
GDAnalyzer's engineer mode includes an Export Line Tool page. With one click, the RD packages the current test settings, the maXTouch tuning configuration (xcfg) and the firmware into a single standalone production EXE — built on the spot, ready to hand over.
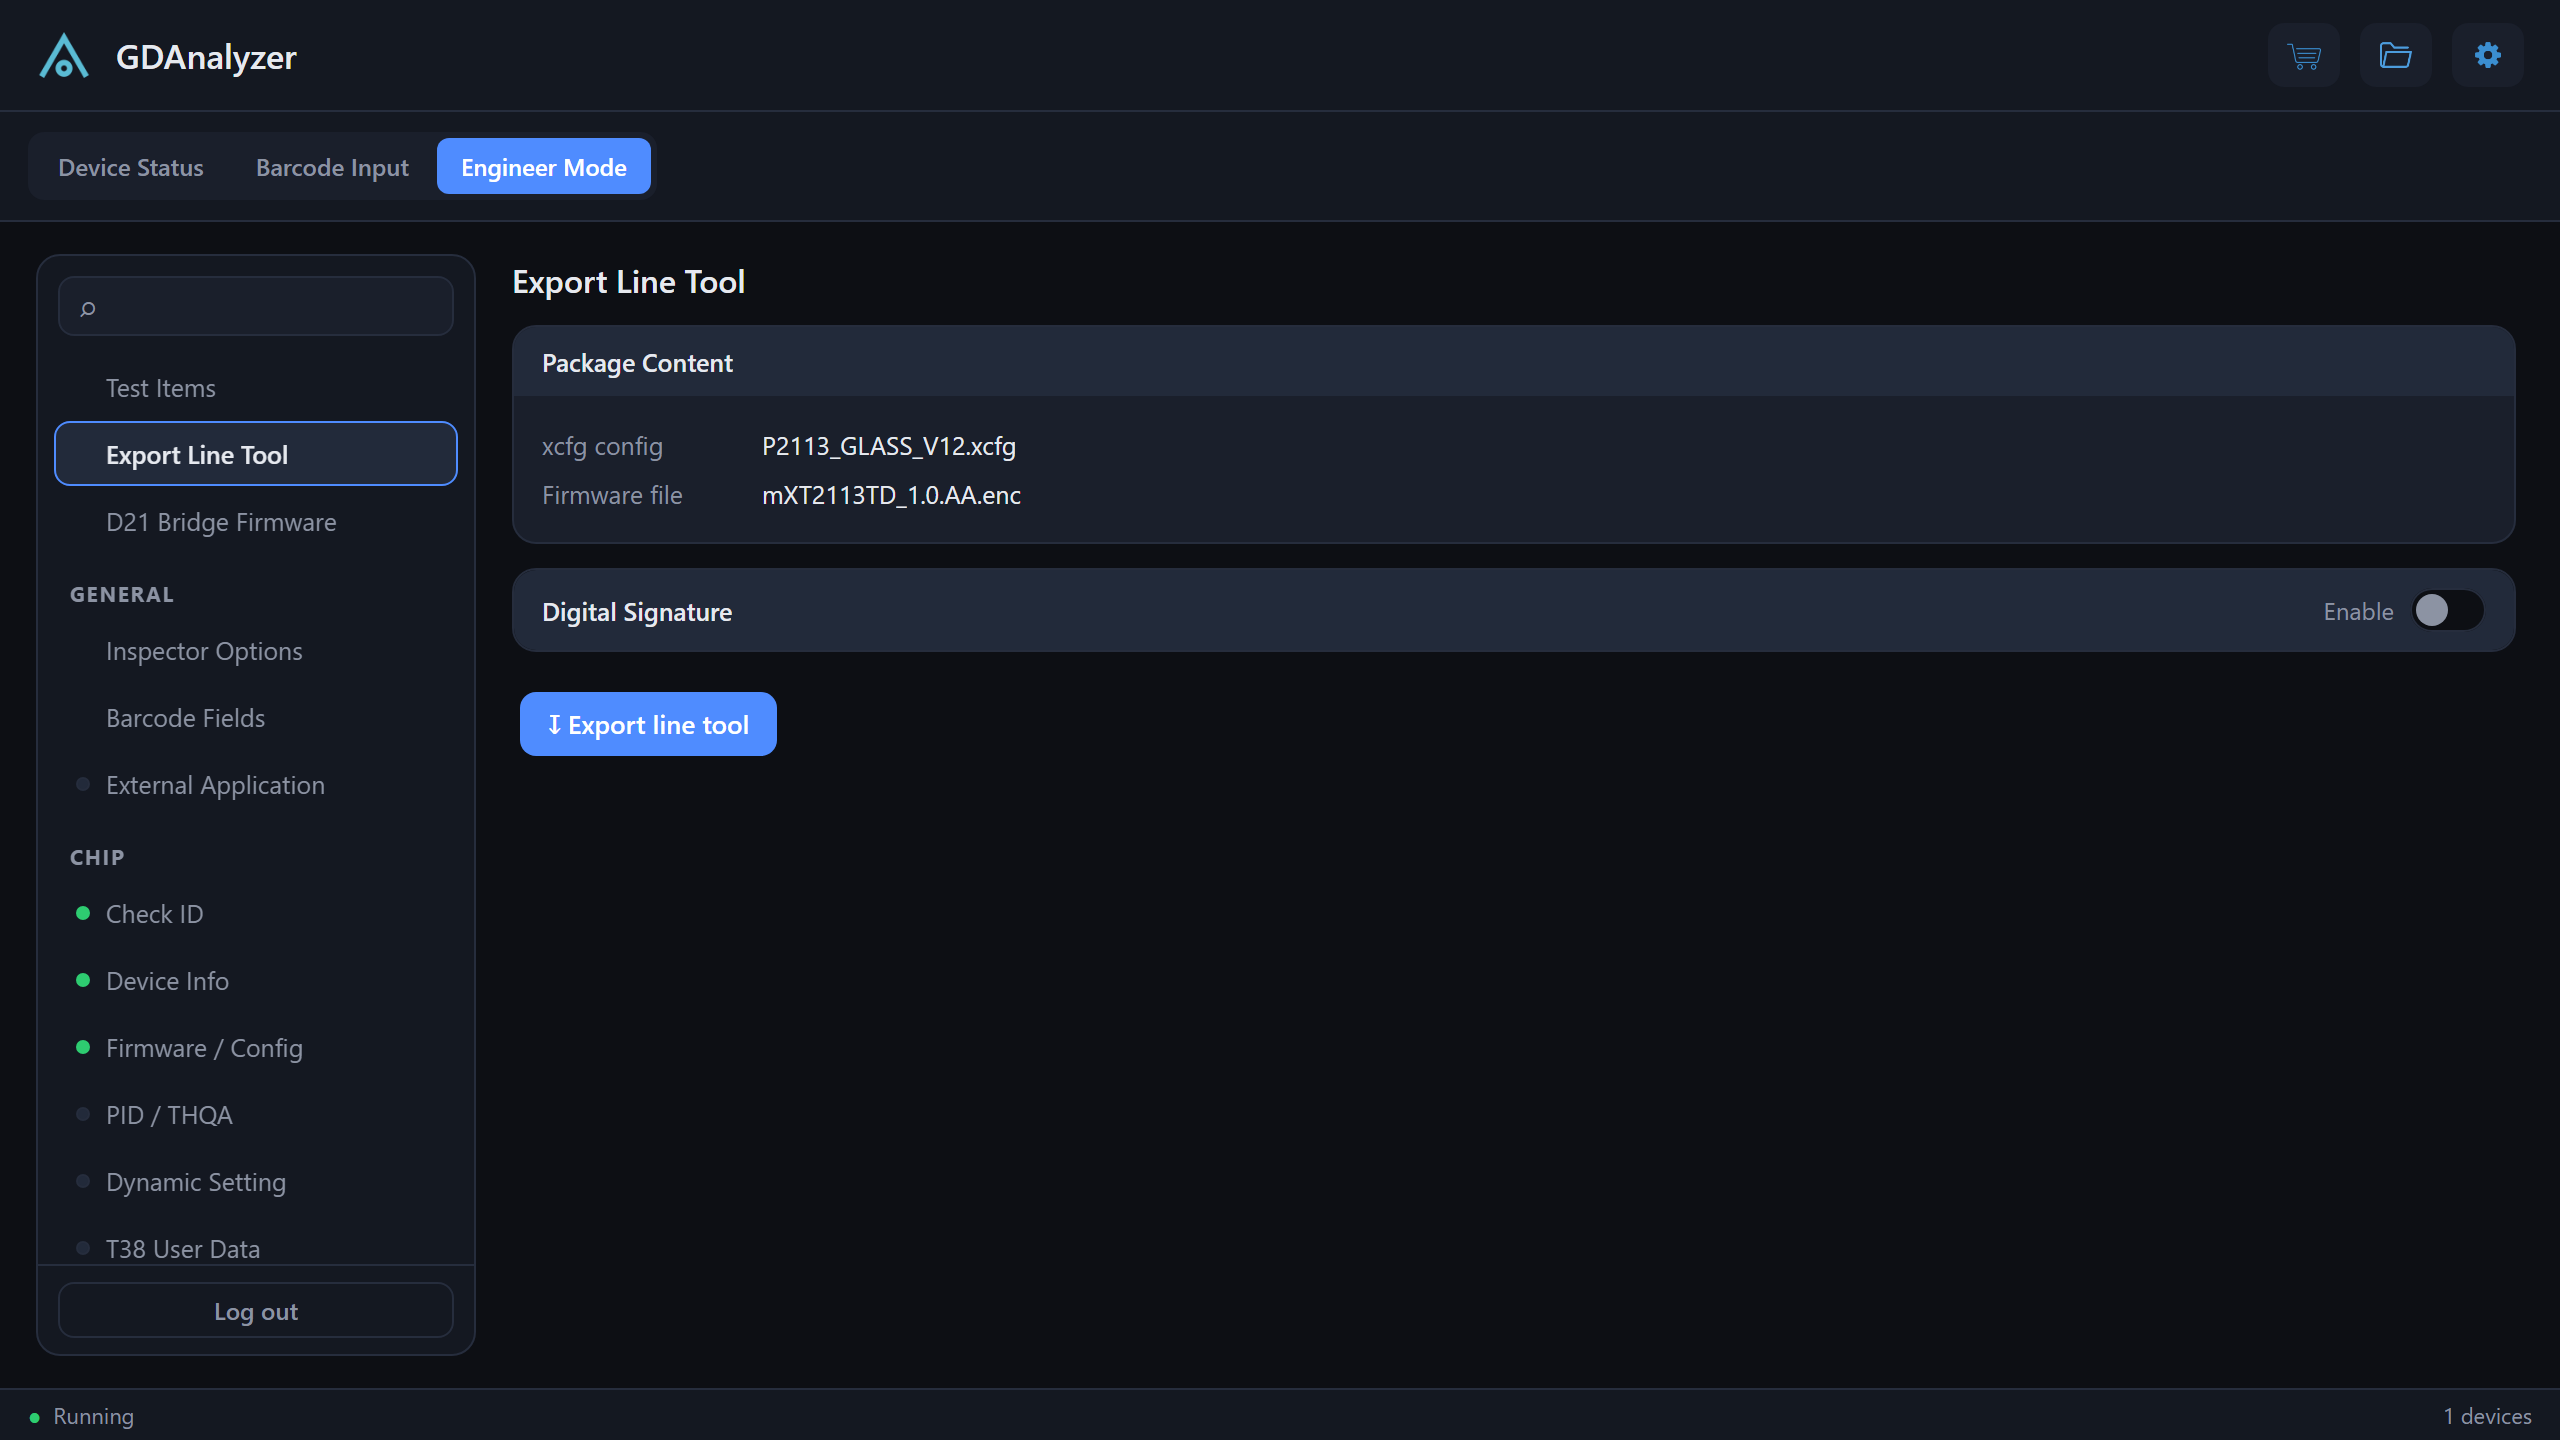
The tuning configuration is encrypted inside the EXE container, so it never travels as a readable file. This substantially raises the technical cost of extracting the tuning data, while the line still runs the full-quality test — no more simplified, watered-down tuning files.
Also built in: optional Authenticode digital signing with your own certificate, a configuration checksum badge shown at the top-right corner of the line EXE so operators can verify the version at a glance, and a password-protected read-only engineer view for auditing what was packaged — settings can be inspected on the line, but never modified.
Test Coverage
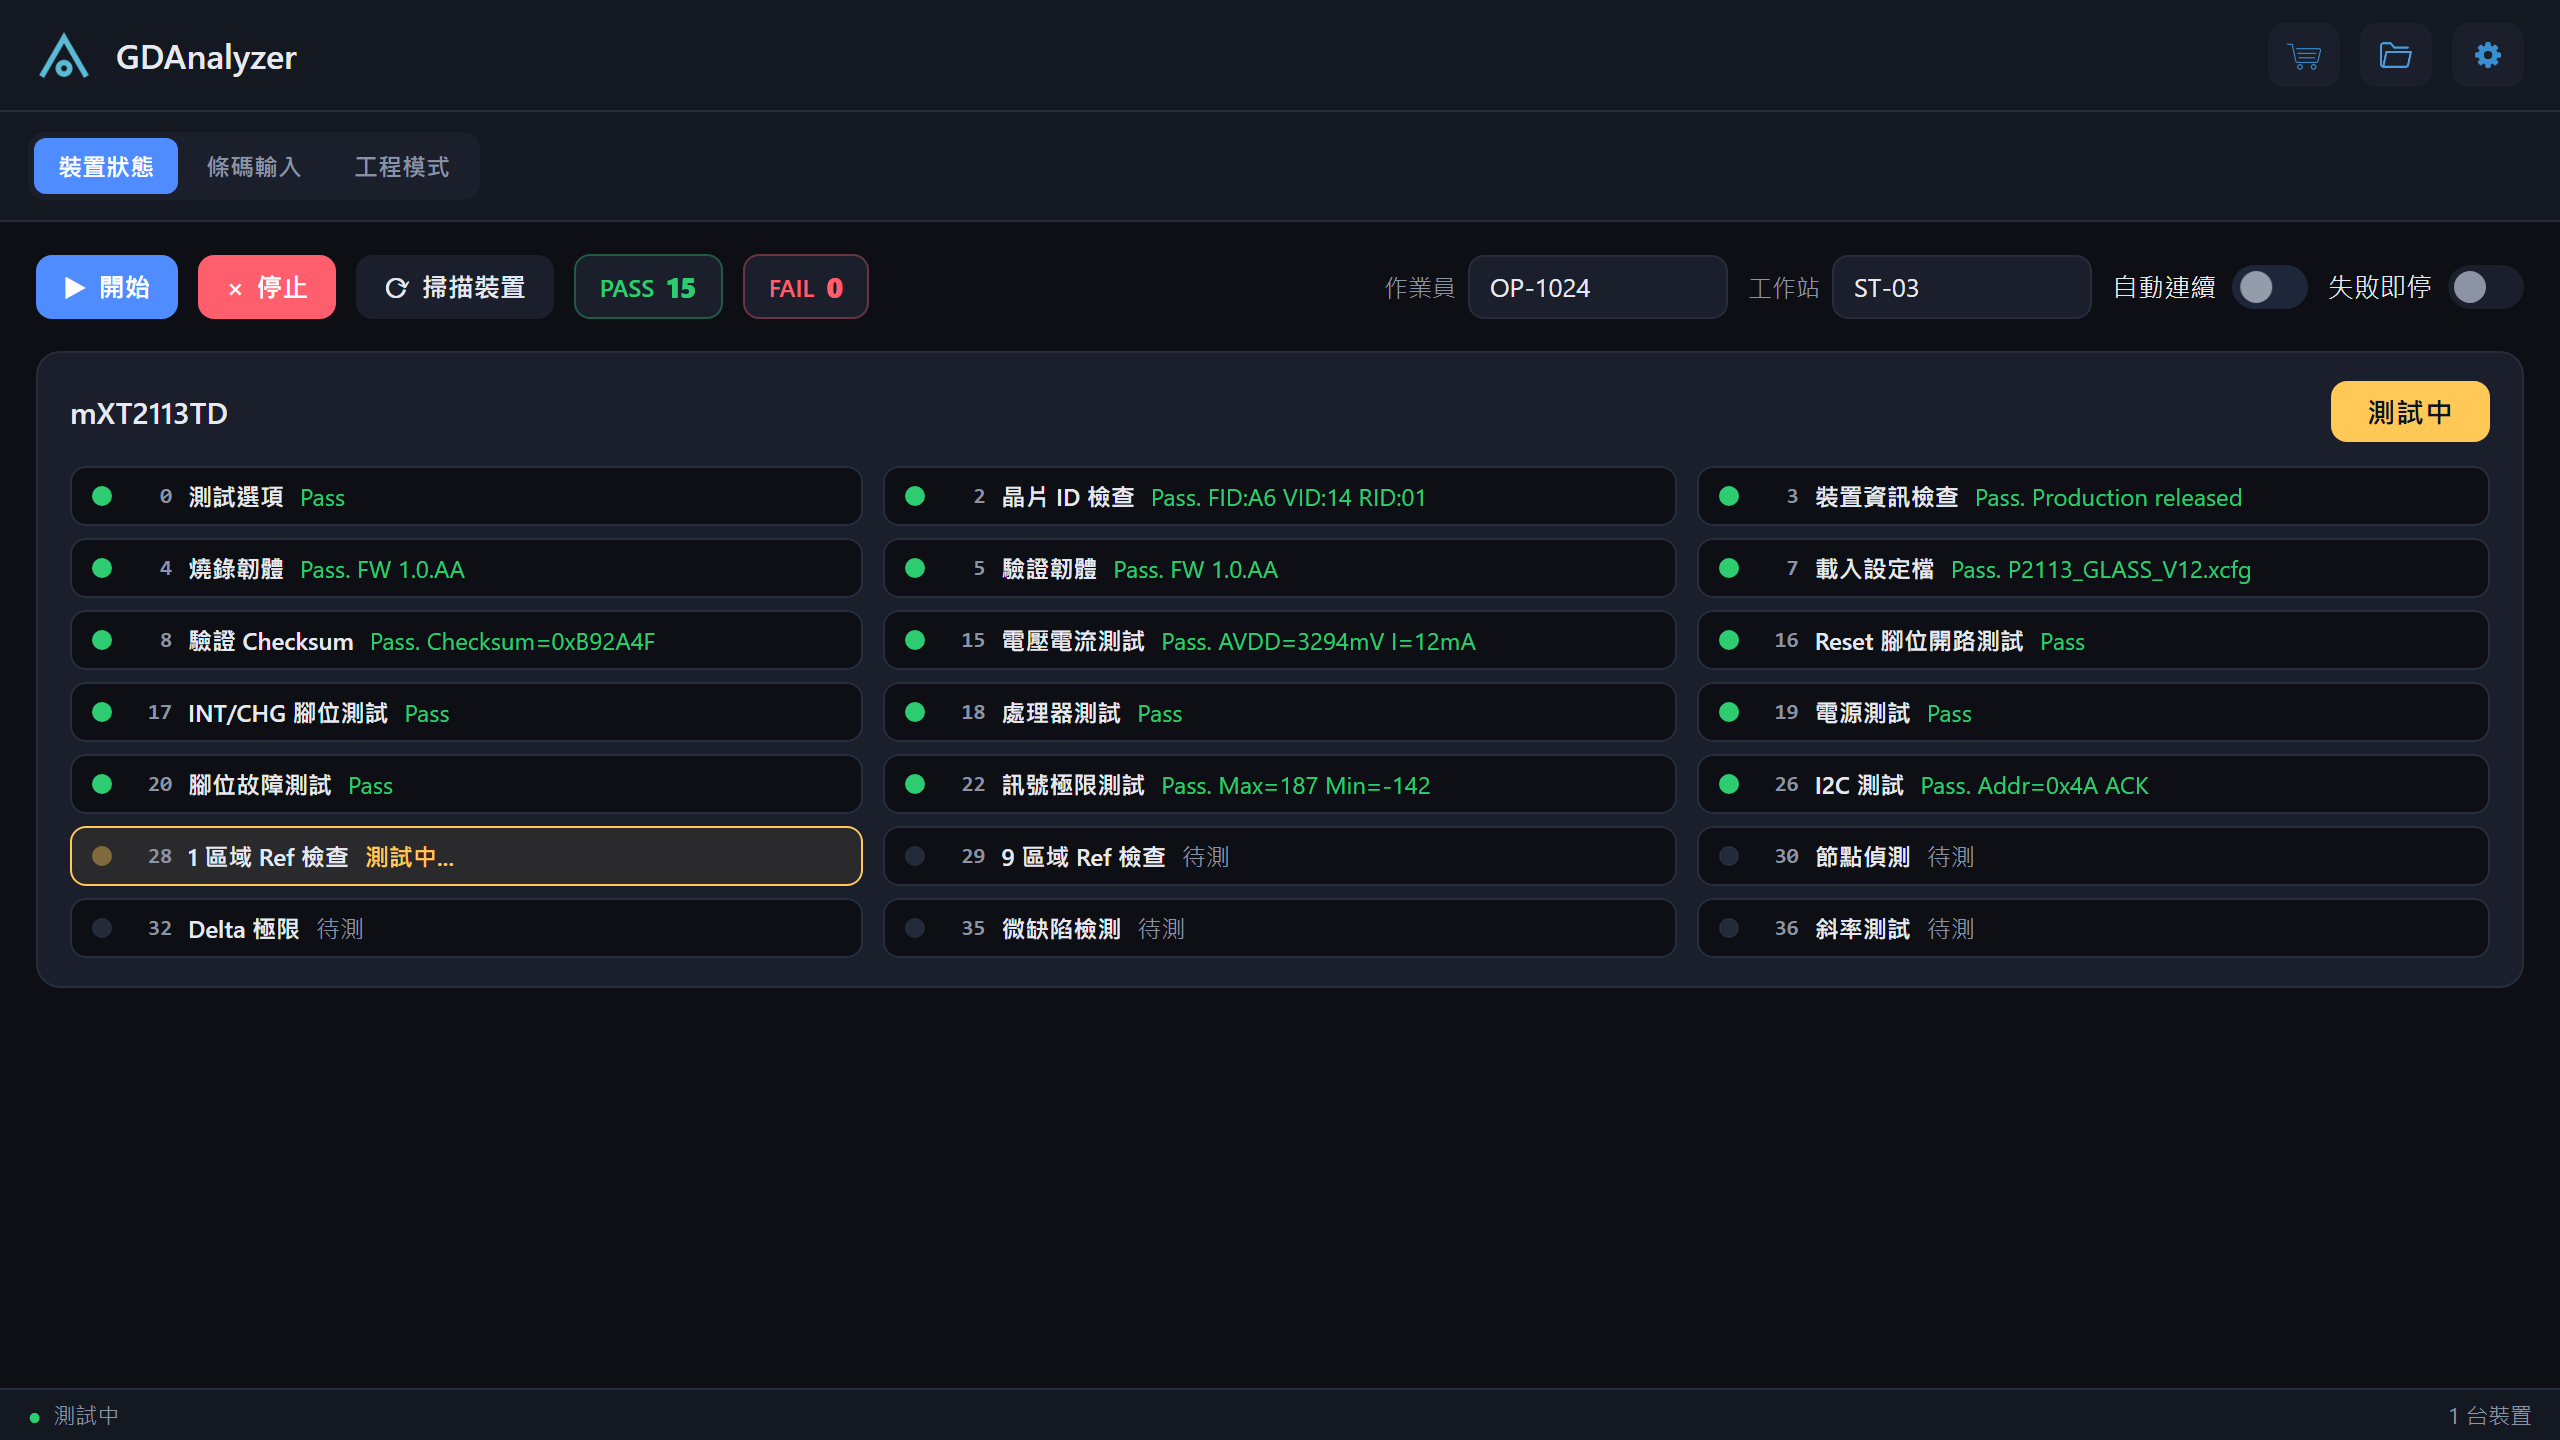
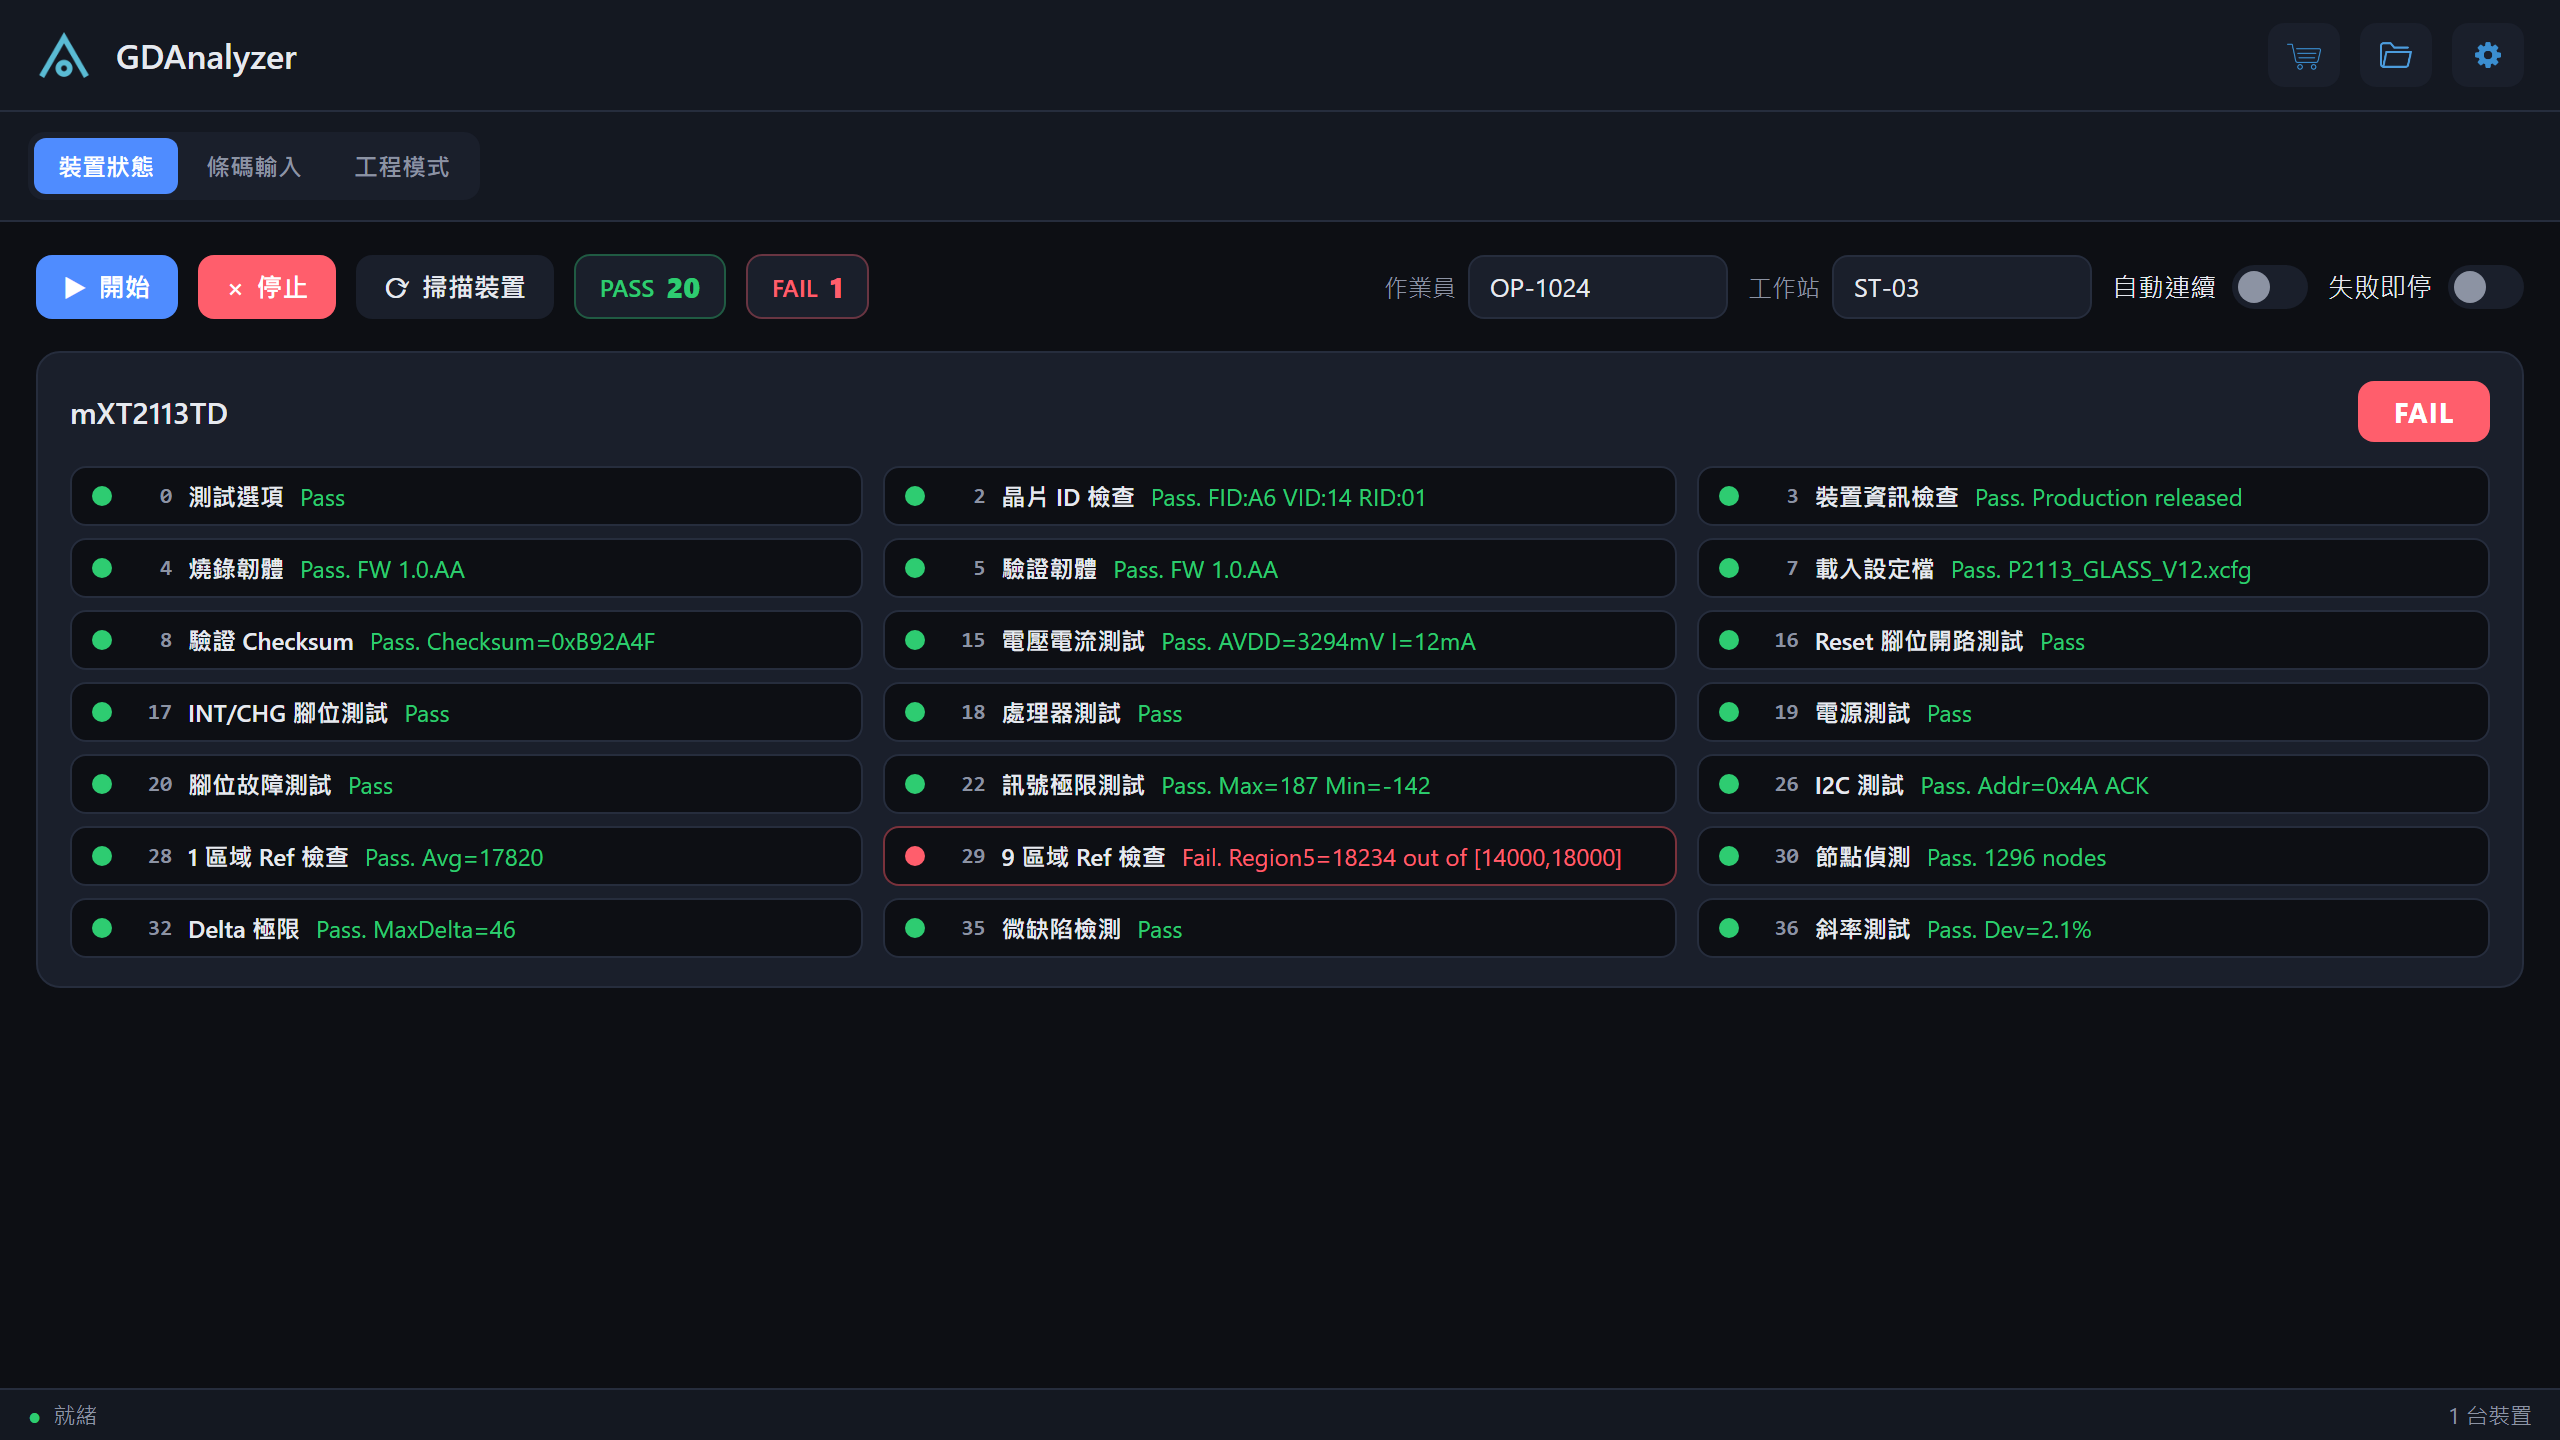
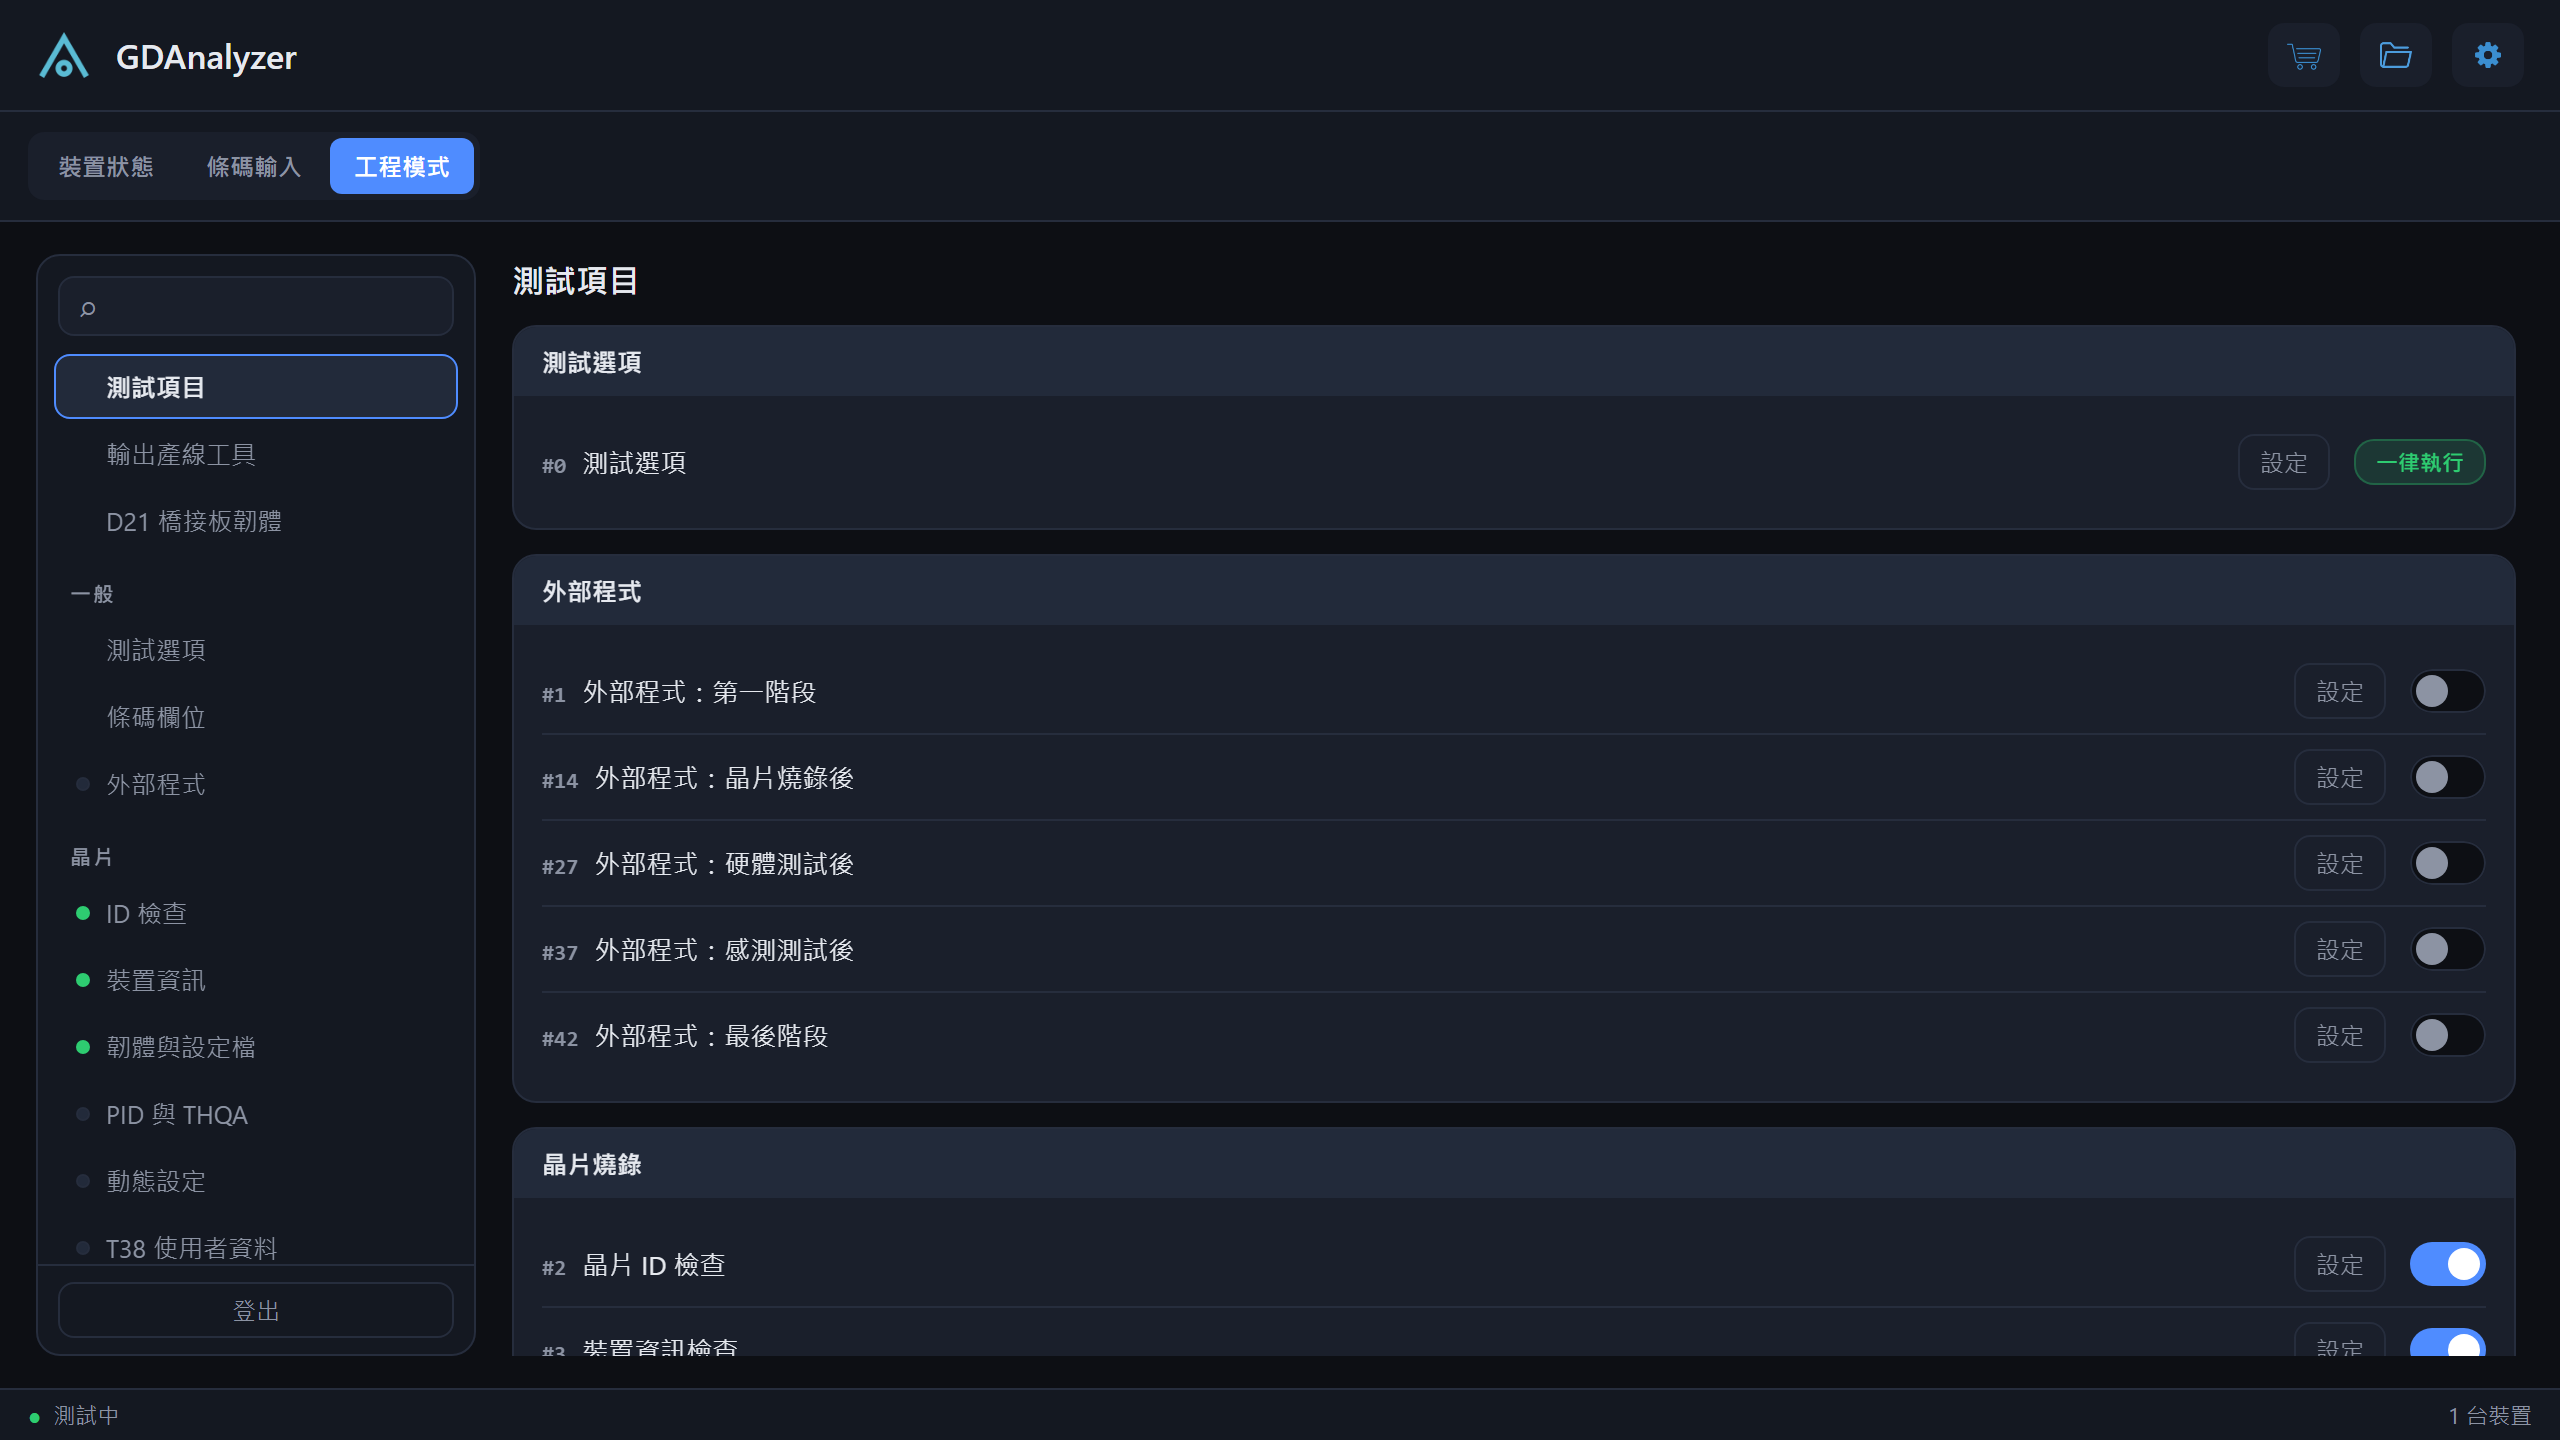
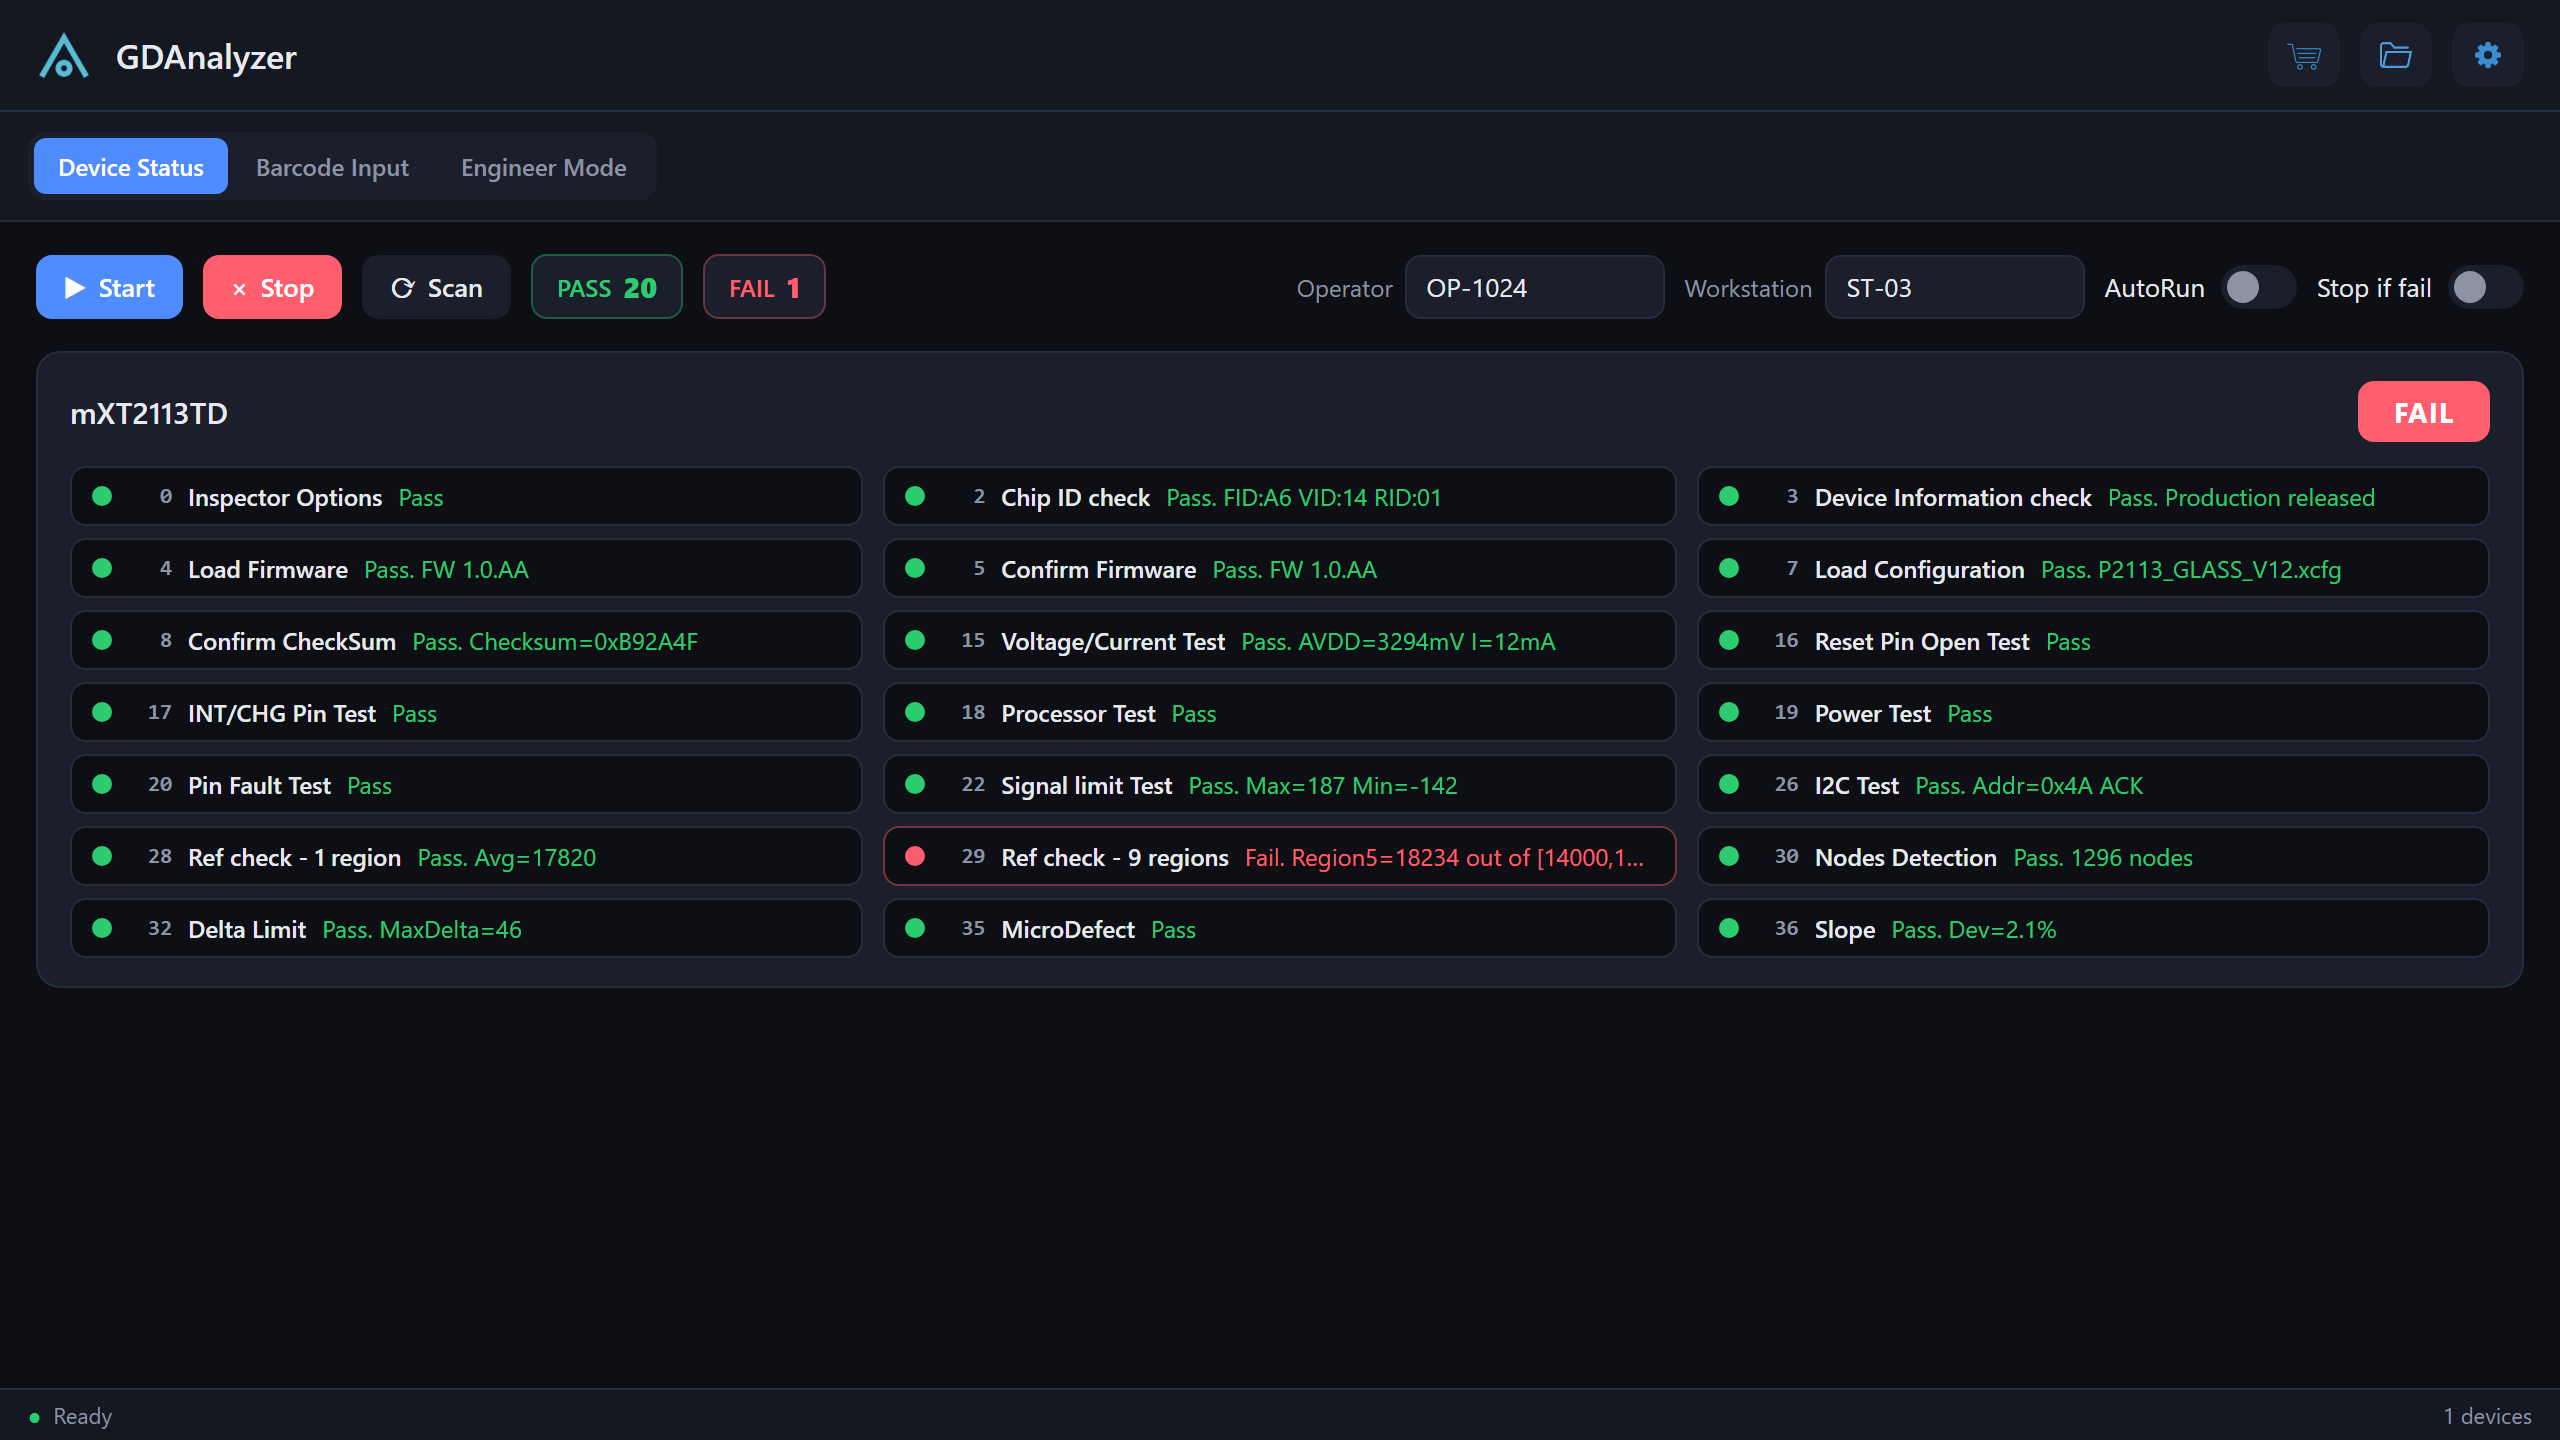
43 test items are organized into six groups. Every item can be enabled, disabled and tuned per project, and failed items are reported with the exact measured values.
| Group | Representative items |
|---|---|
| Test Options | Global behavior: calibration control, abort-on-fail policy, output report file. |
| Chip Upgrade | Chip ID check, load / confirm firmware, load configuration, checksum confirm, PID & THQA, T38 user data, T68 PDS data, USB serial number. |
| HW Test | Voltage / current, reset pin open, INT/CHG pin, processor, power, pin fault, signal limit, sync loss, GPIO, I2C. |
| Sensor Test | Reference check (1 region / 9 regions), nodes detection, sensor variant, delta limit, self-cap, key array, micro-defect, slope. |
| Integration Test | FreeRun drawing, fill-in drawing, false trigger collection, noise level — operator-interactive on-screen touch tests. |
| External APP | Hook external programs at five stages of the test sequence. |
Engineer Mode
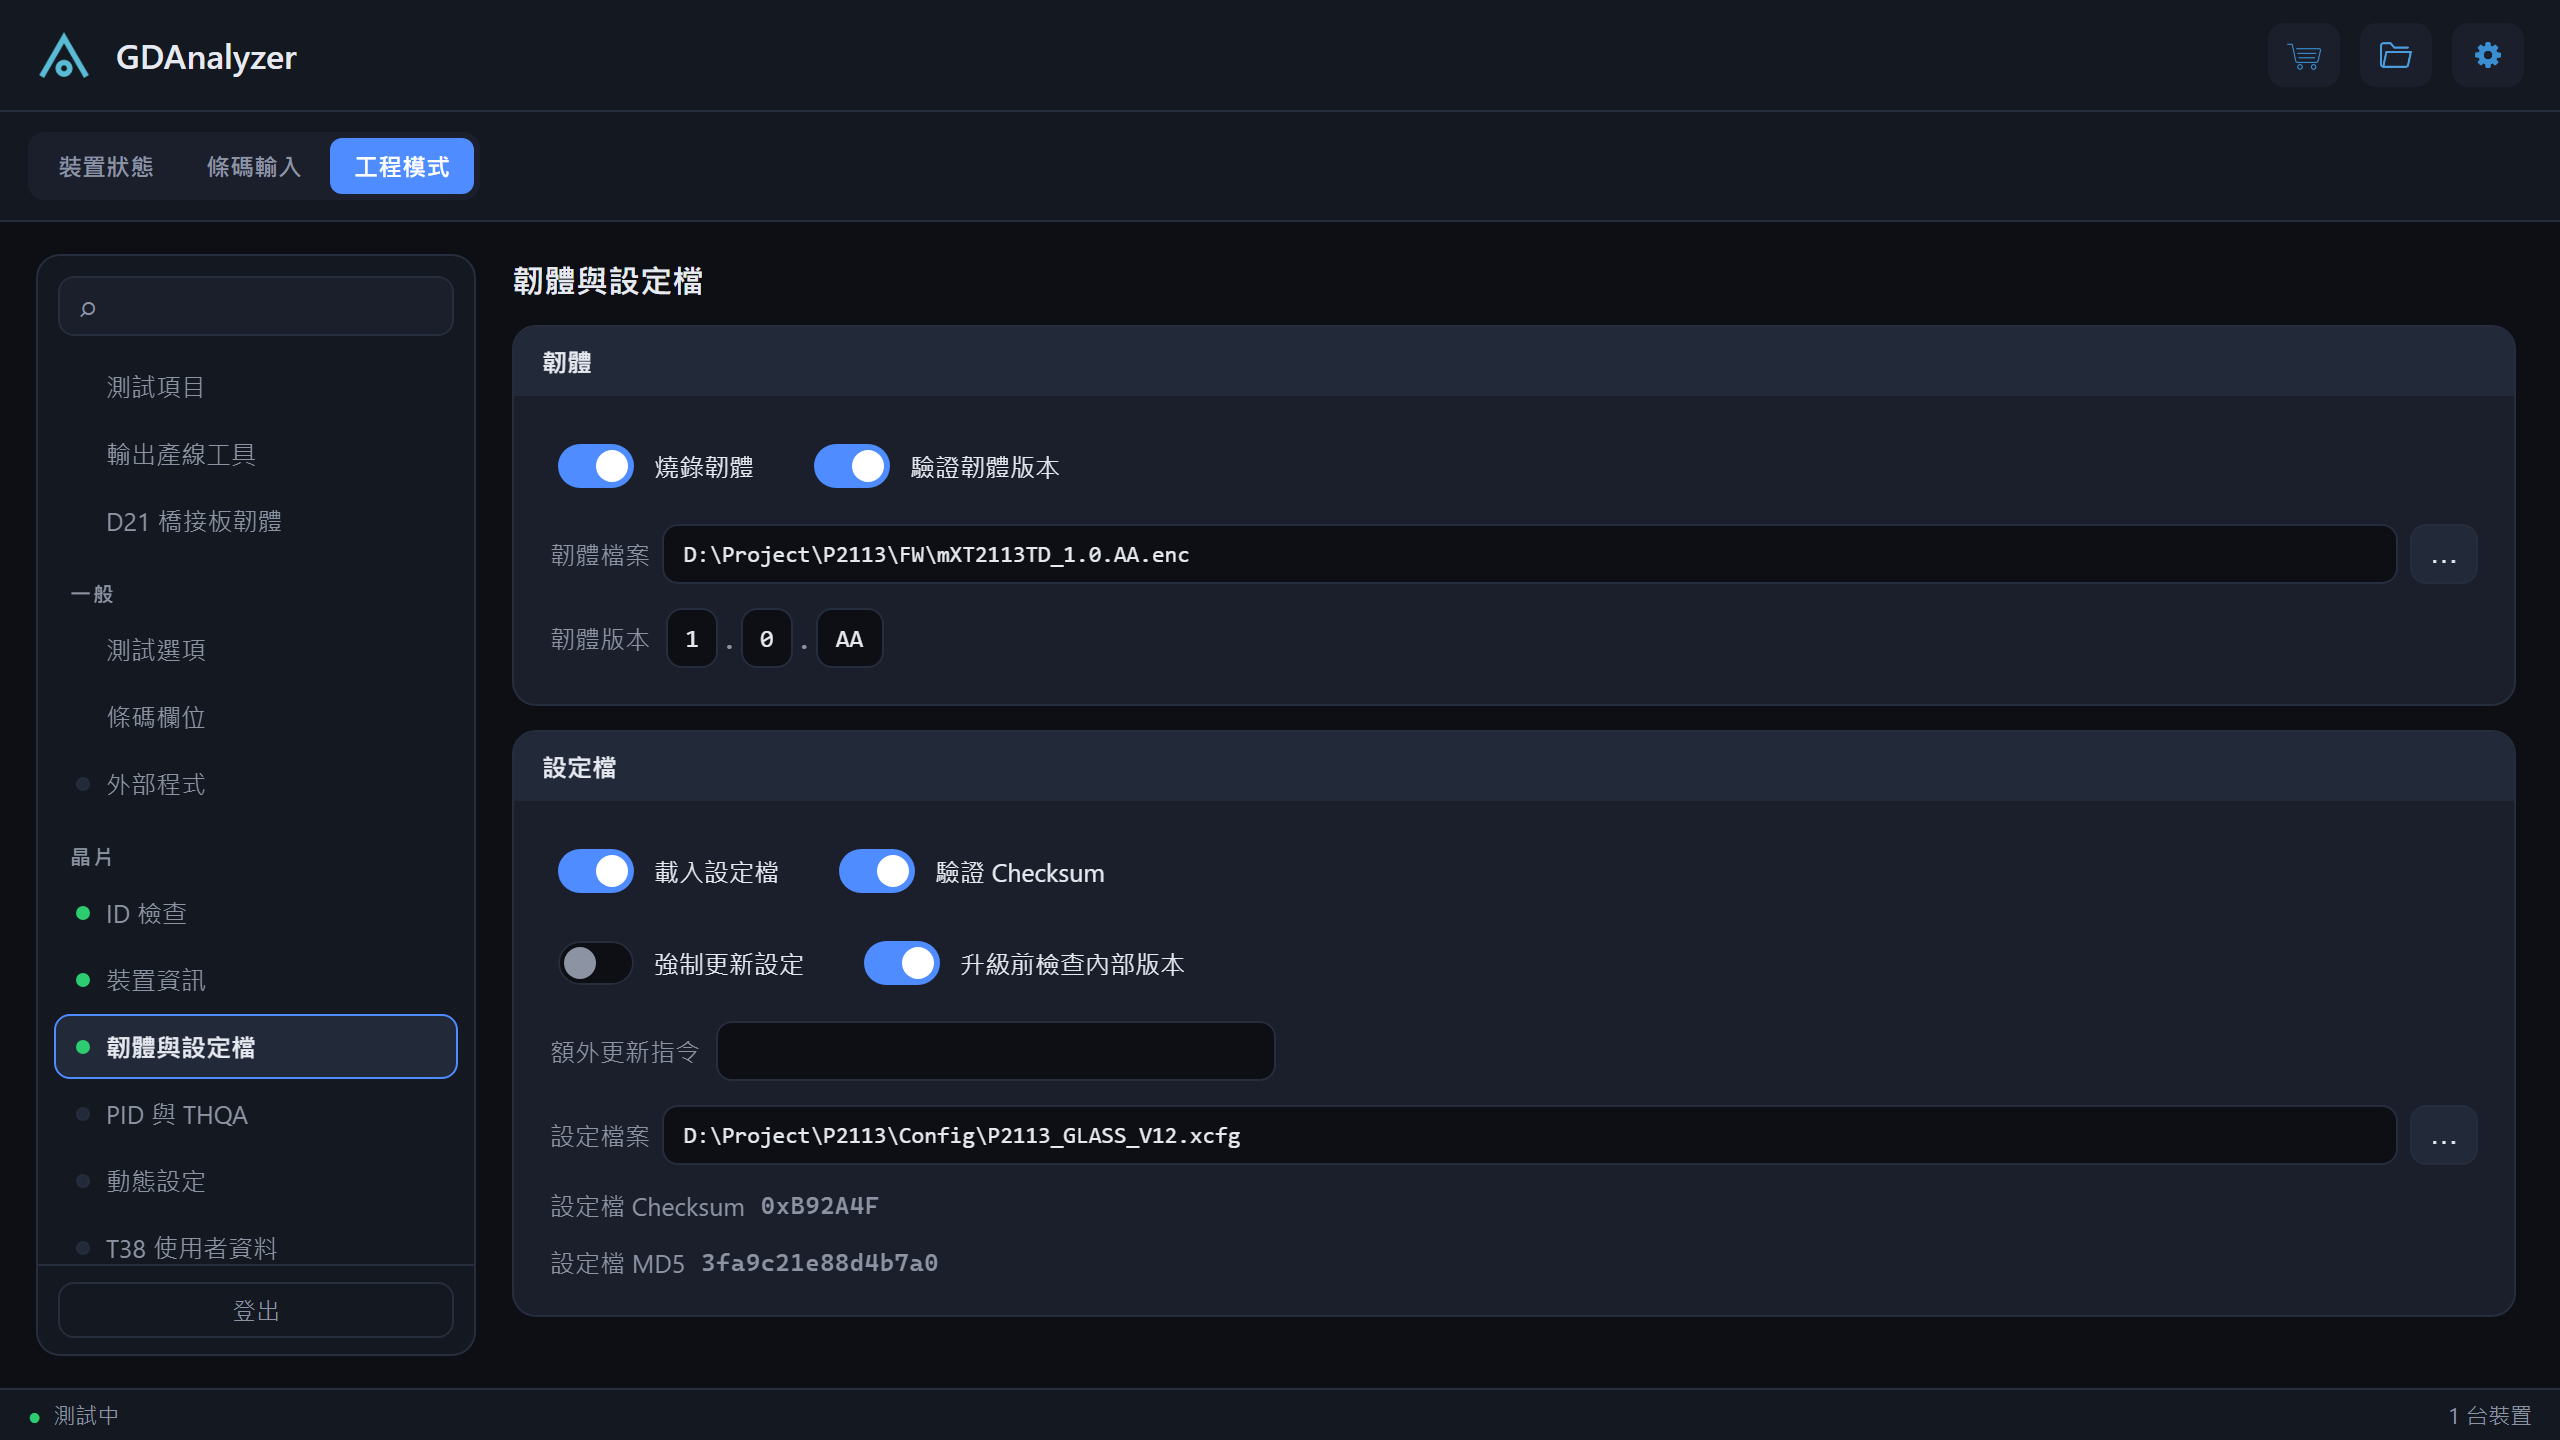
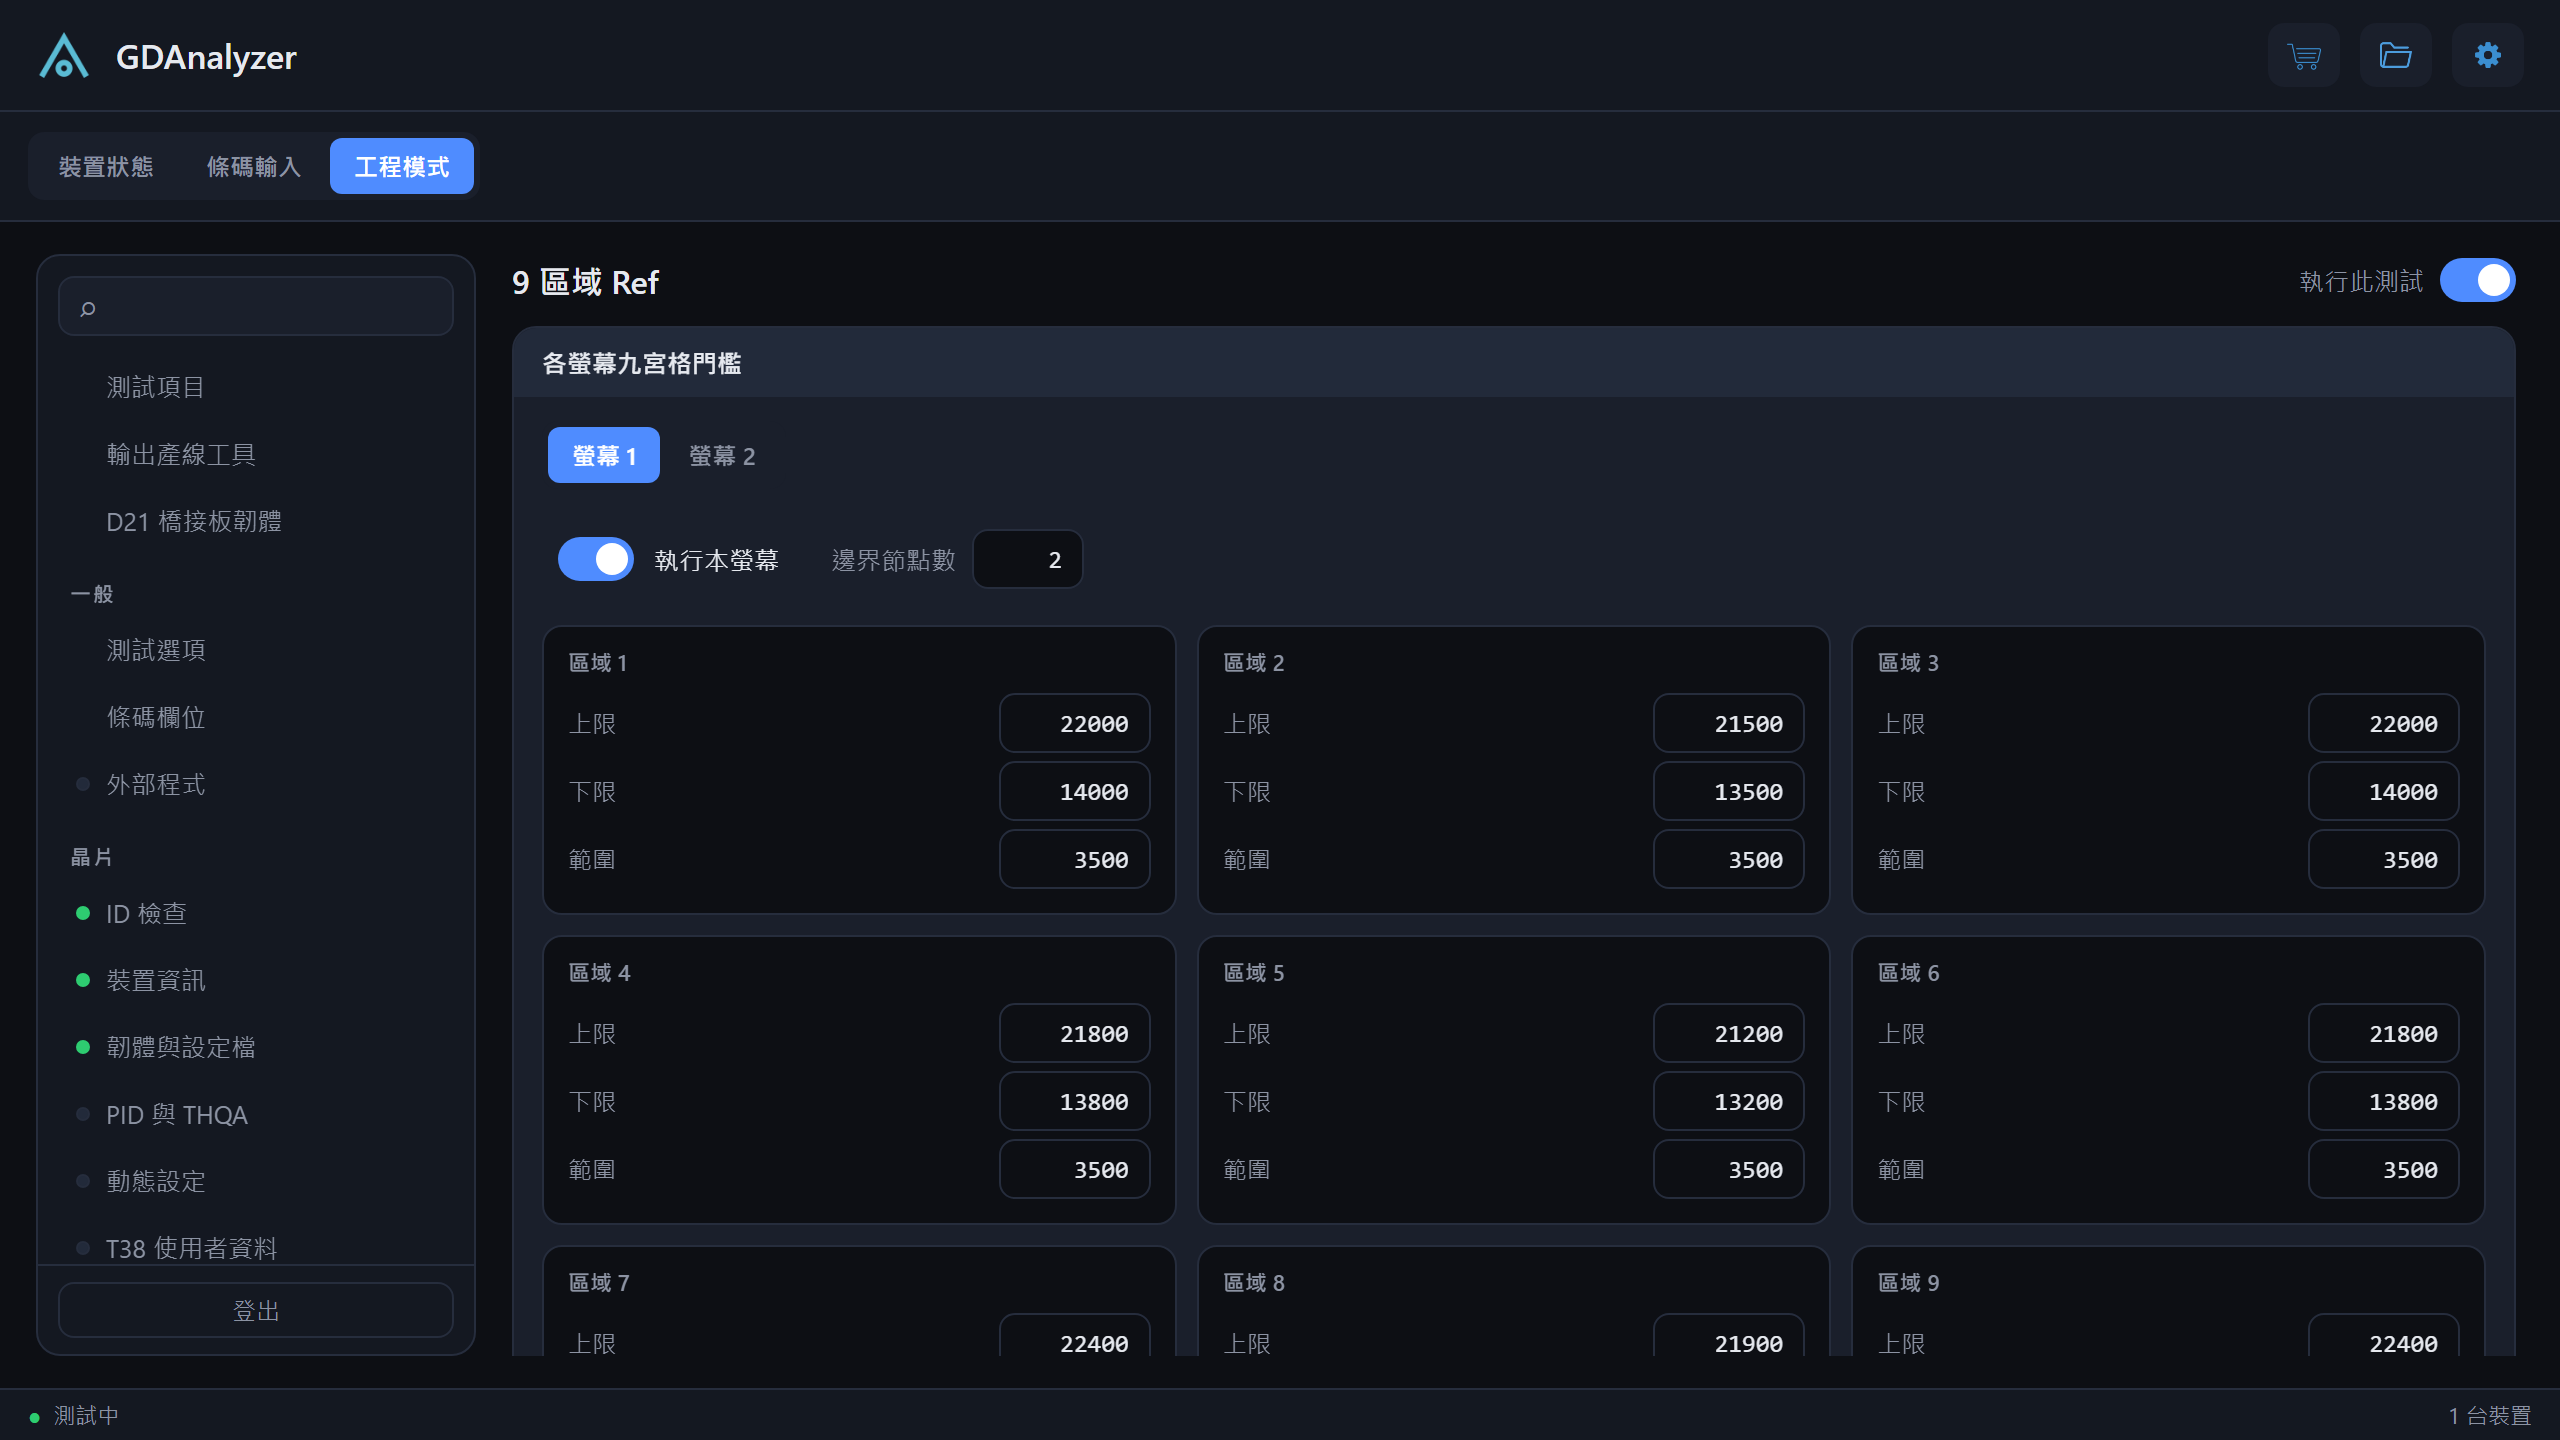
A password-protected engineer mode gathers every setting into dedicated pages with a searchable navigation — test item switches, per-screen sensor thresholds, barcode field rules, external program hooks and more. Every change is saved instantly. The engineer mode password is zprevouj68zgr.
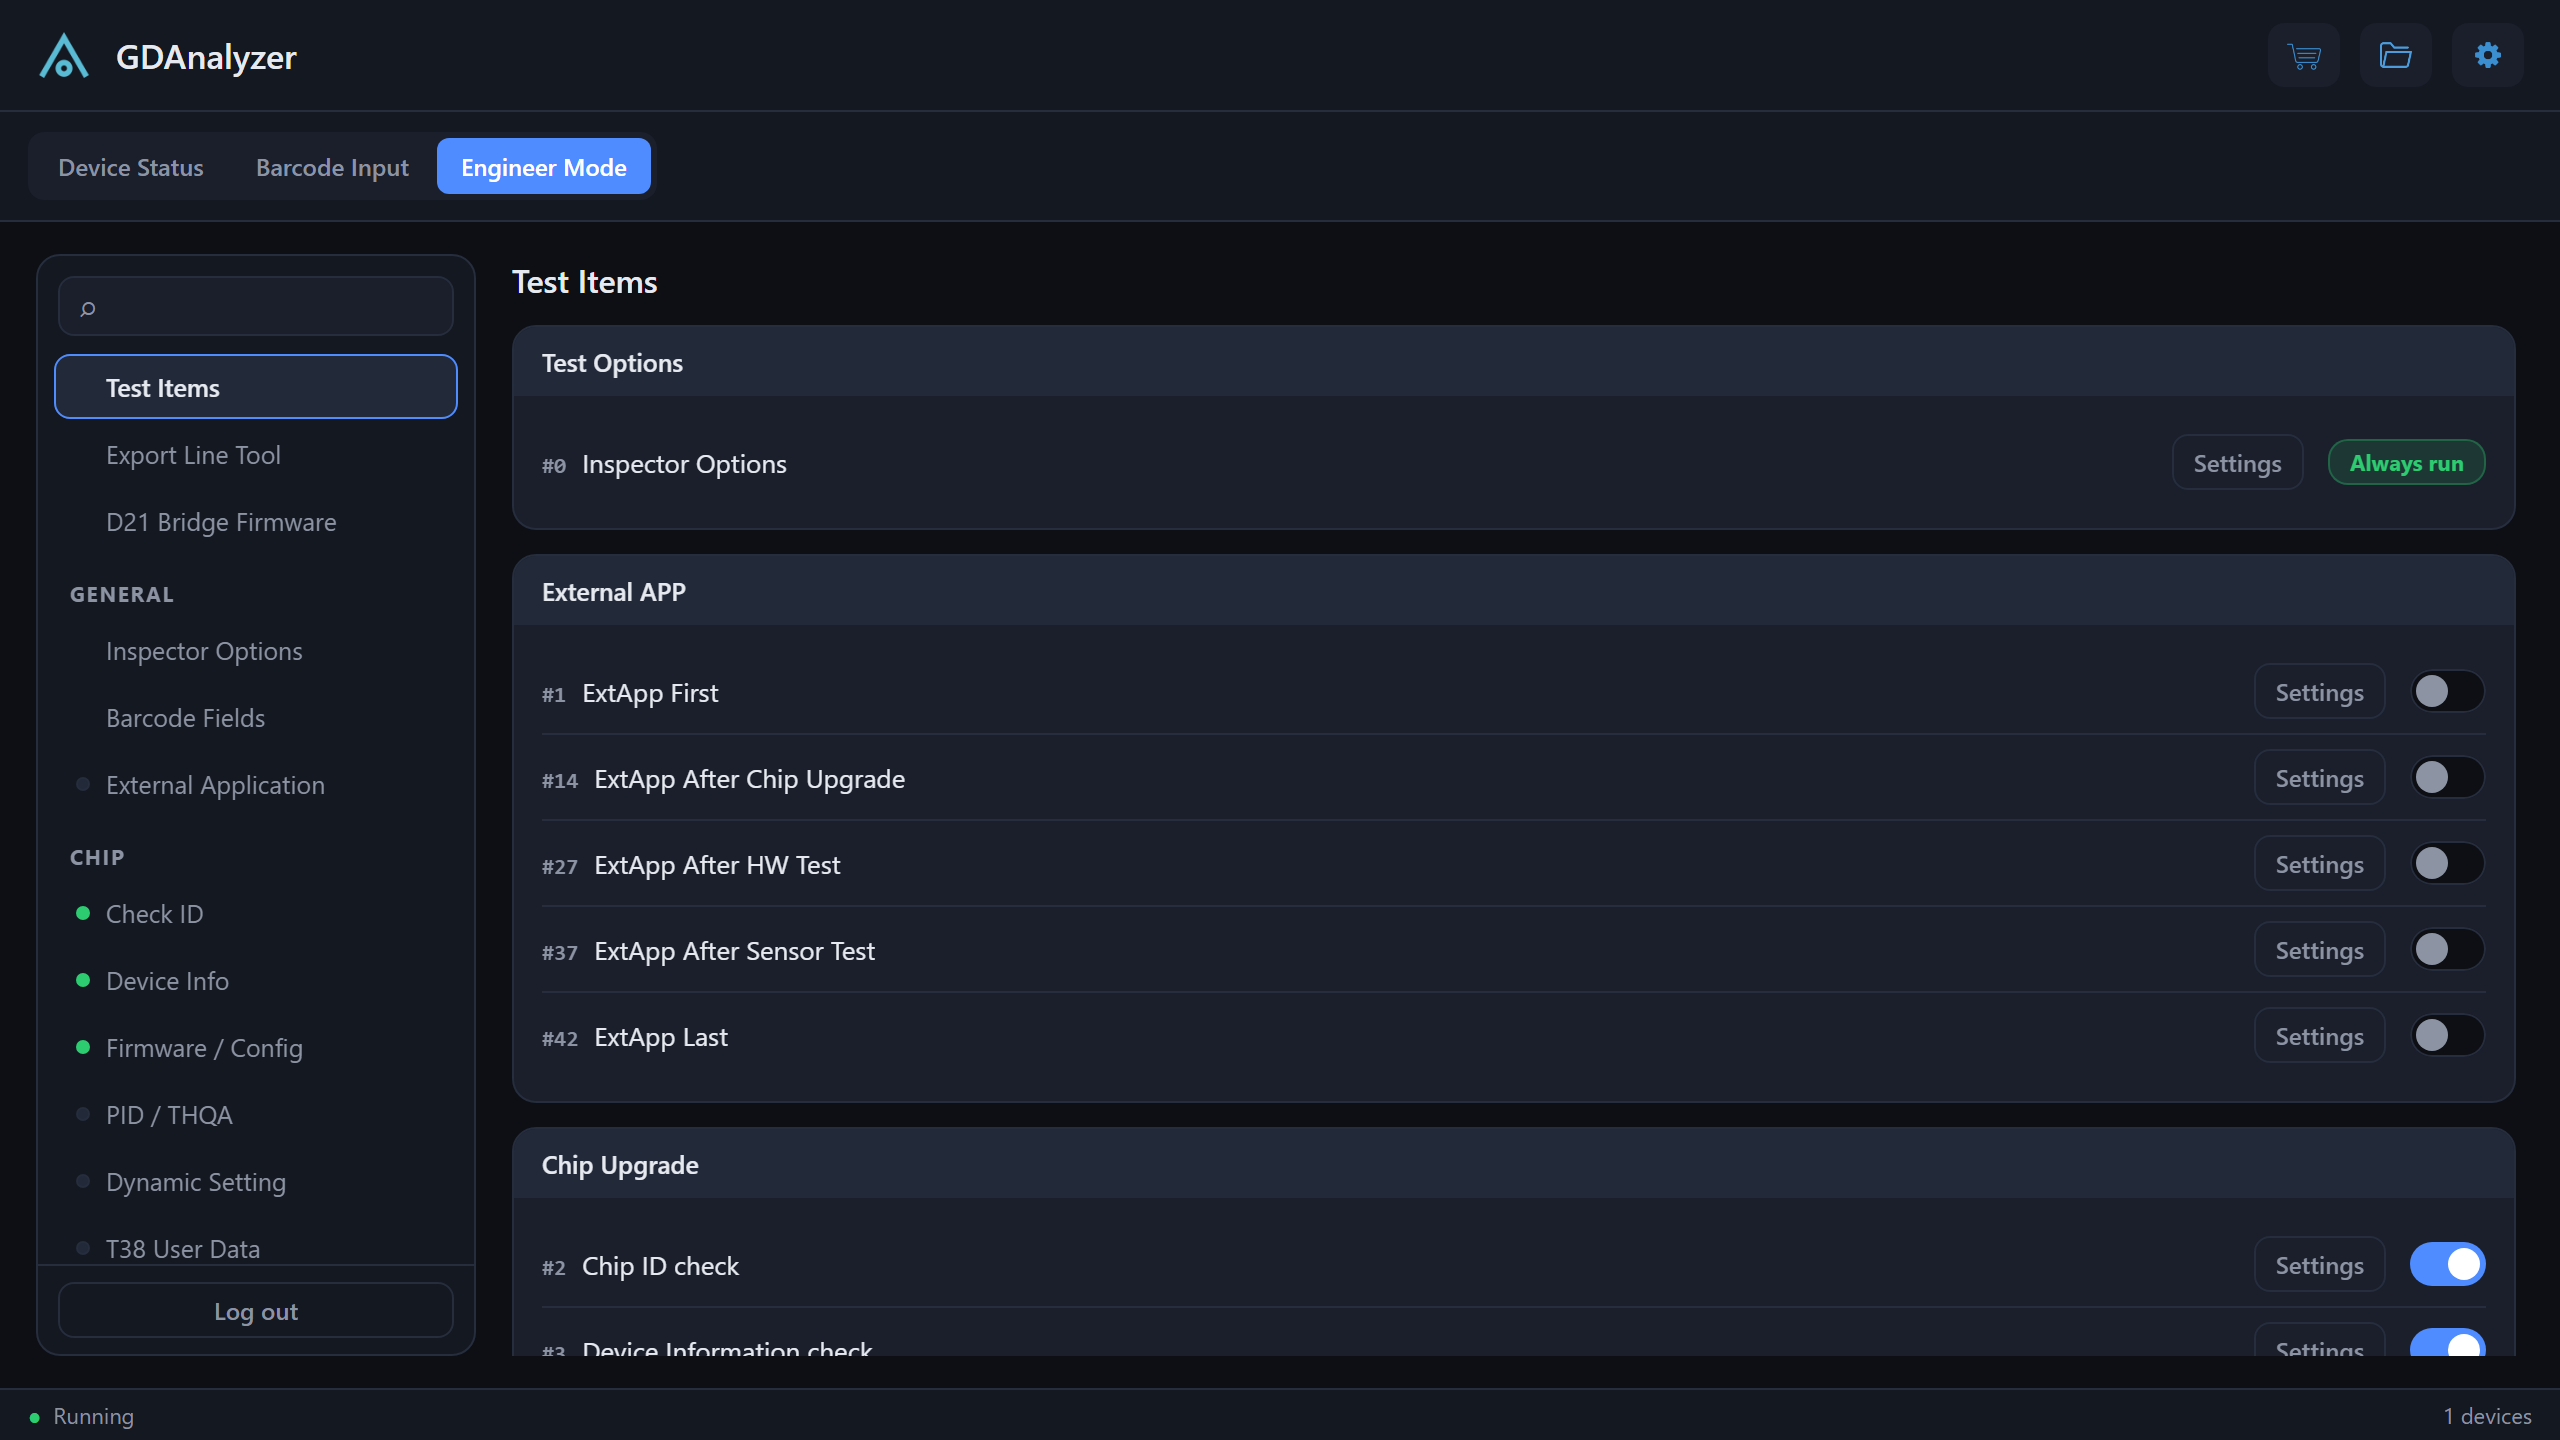
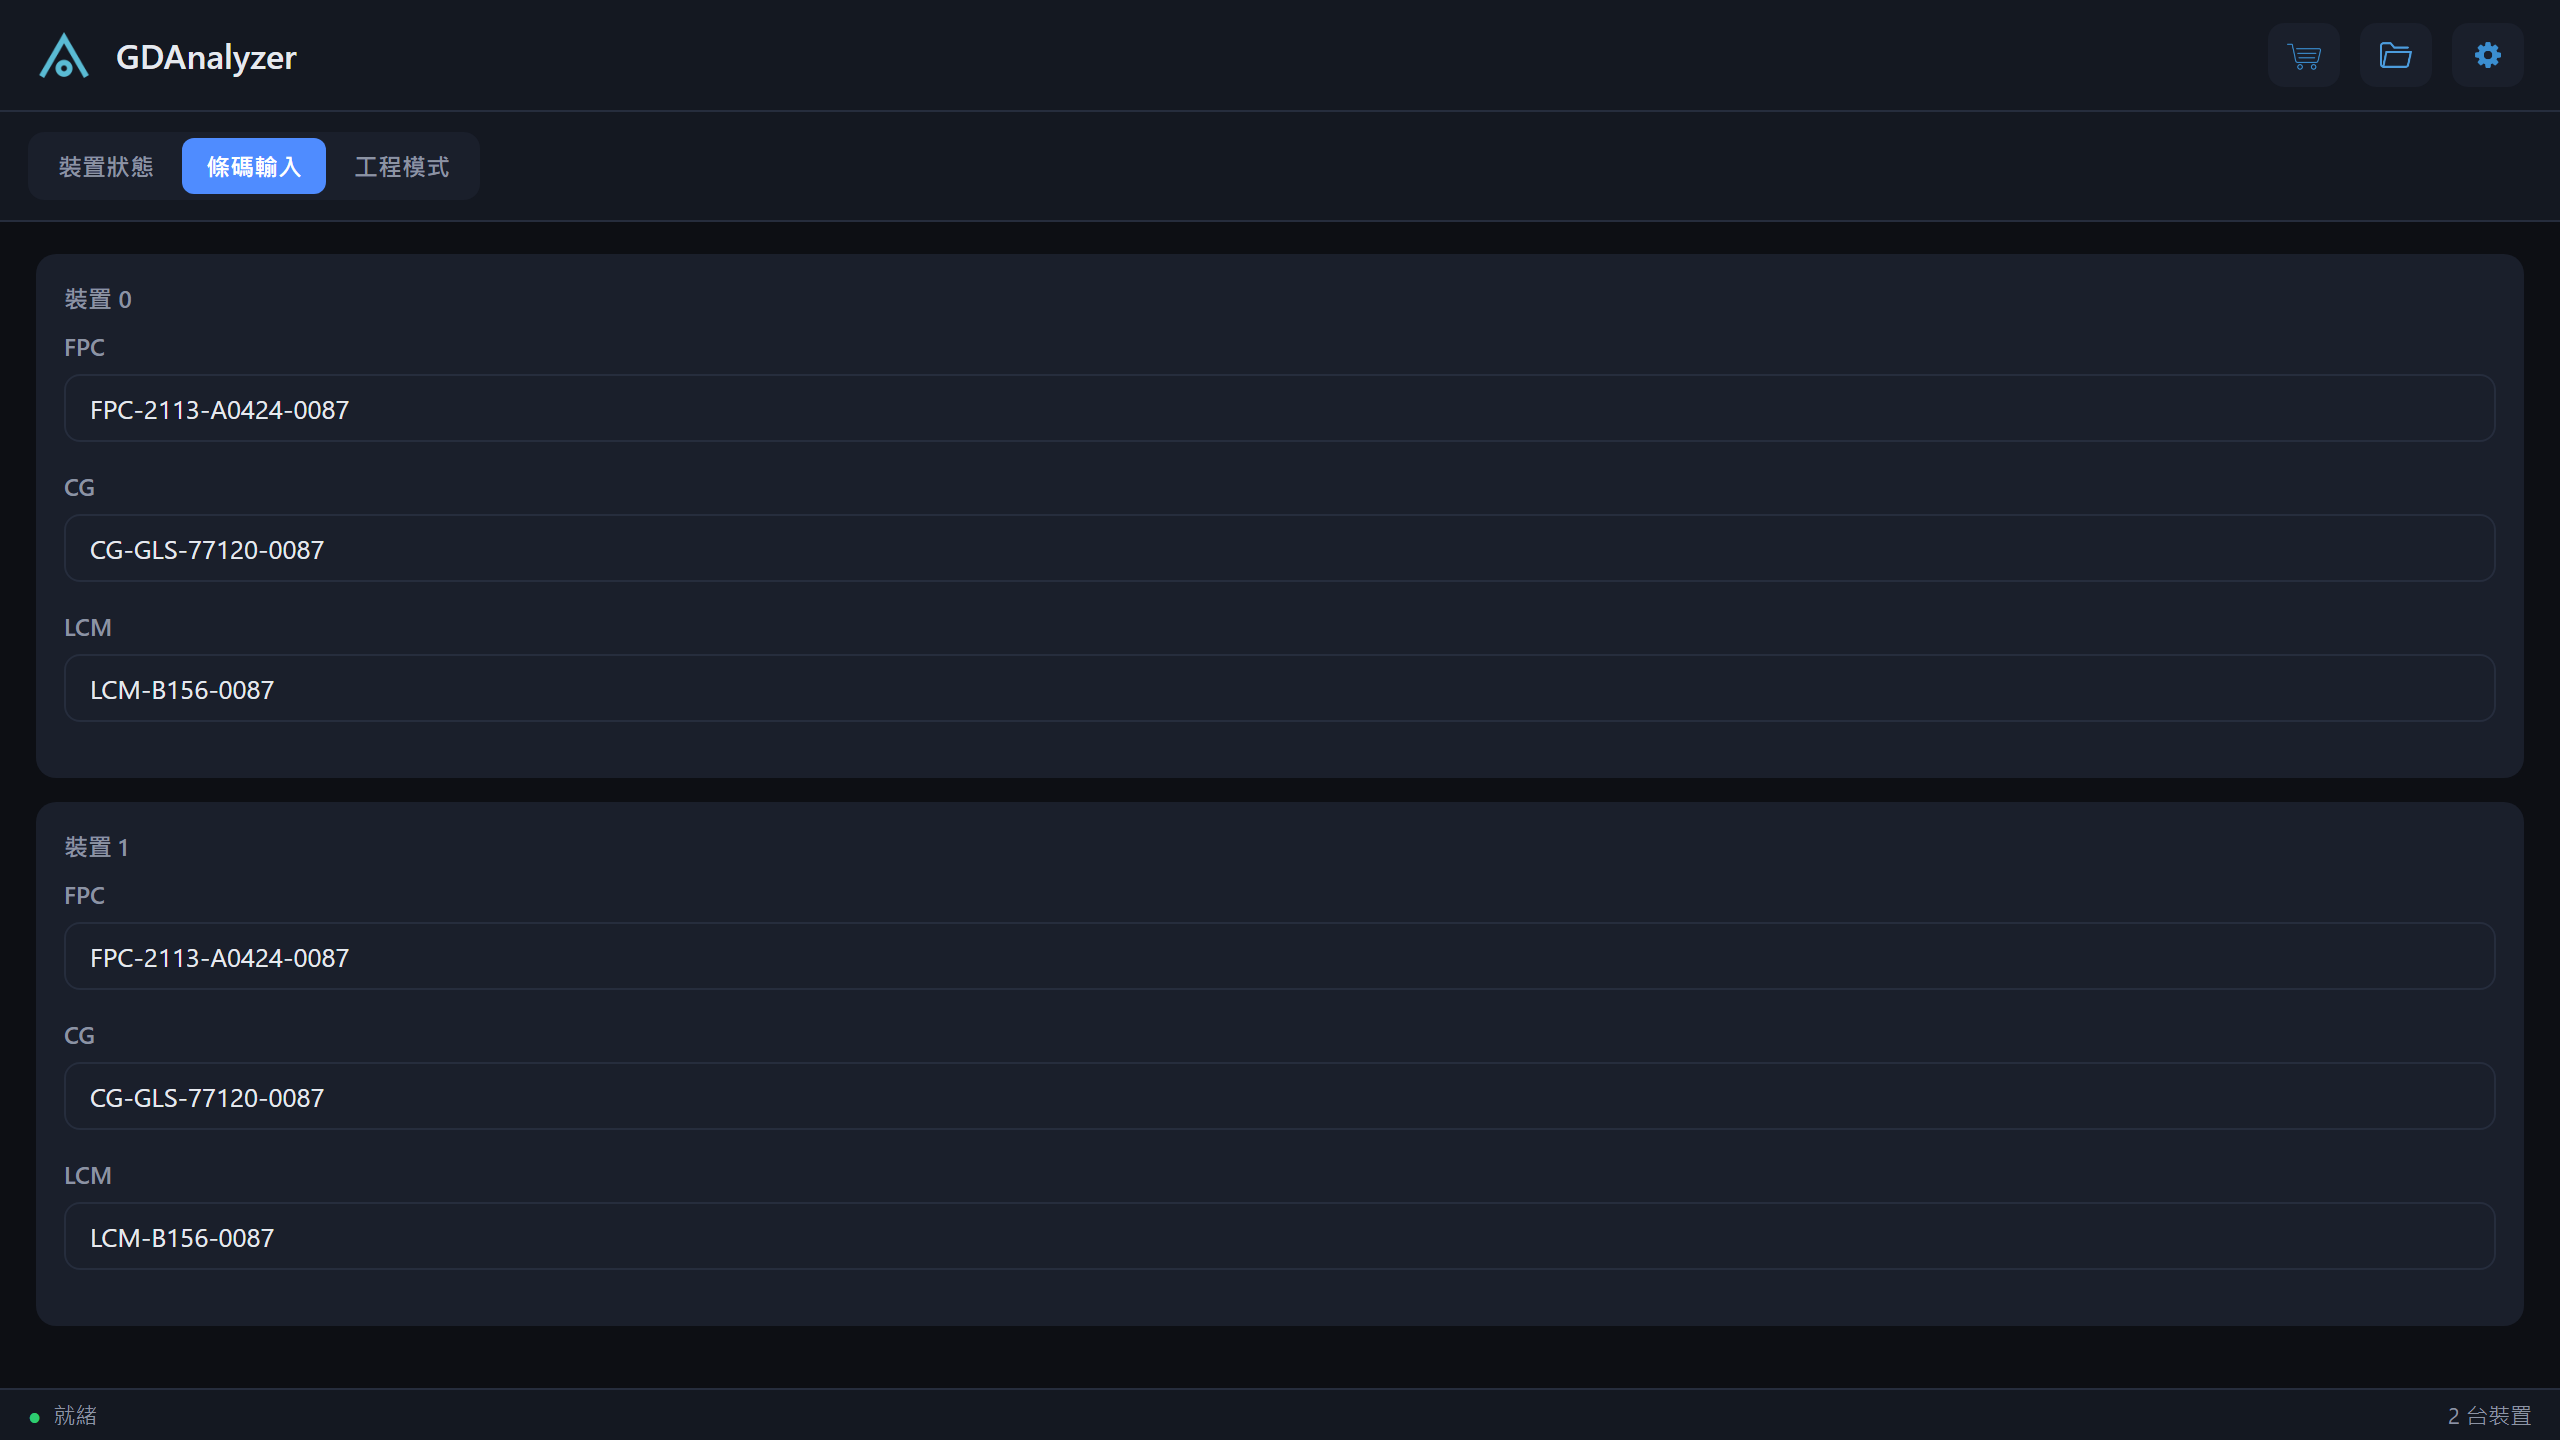
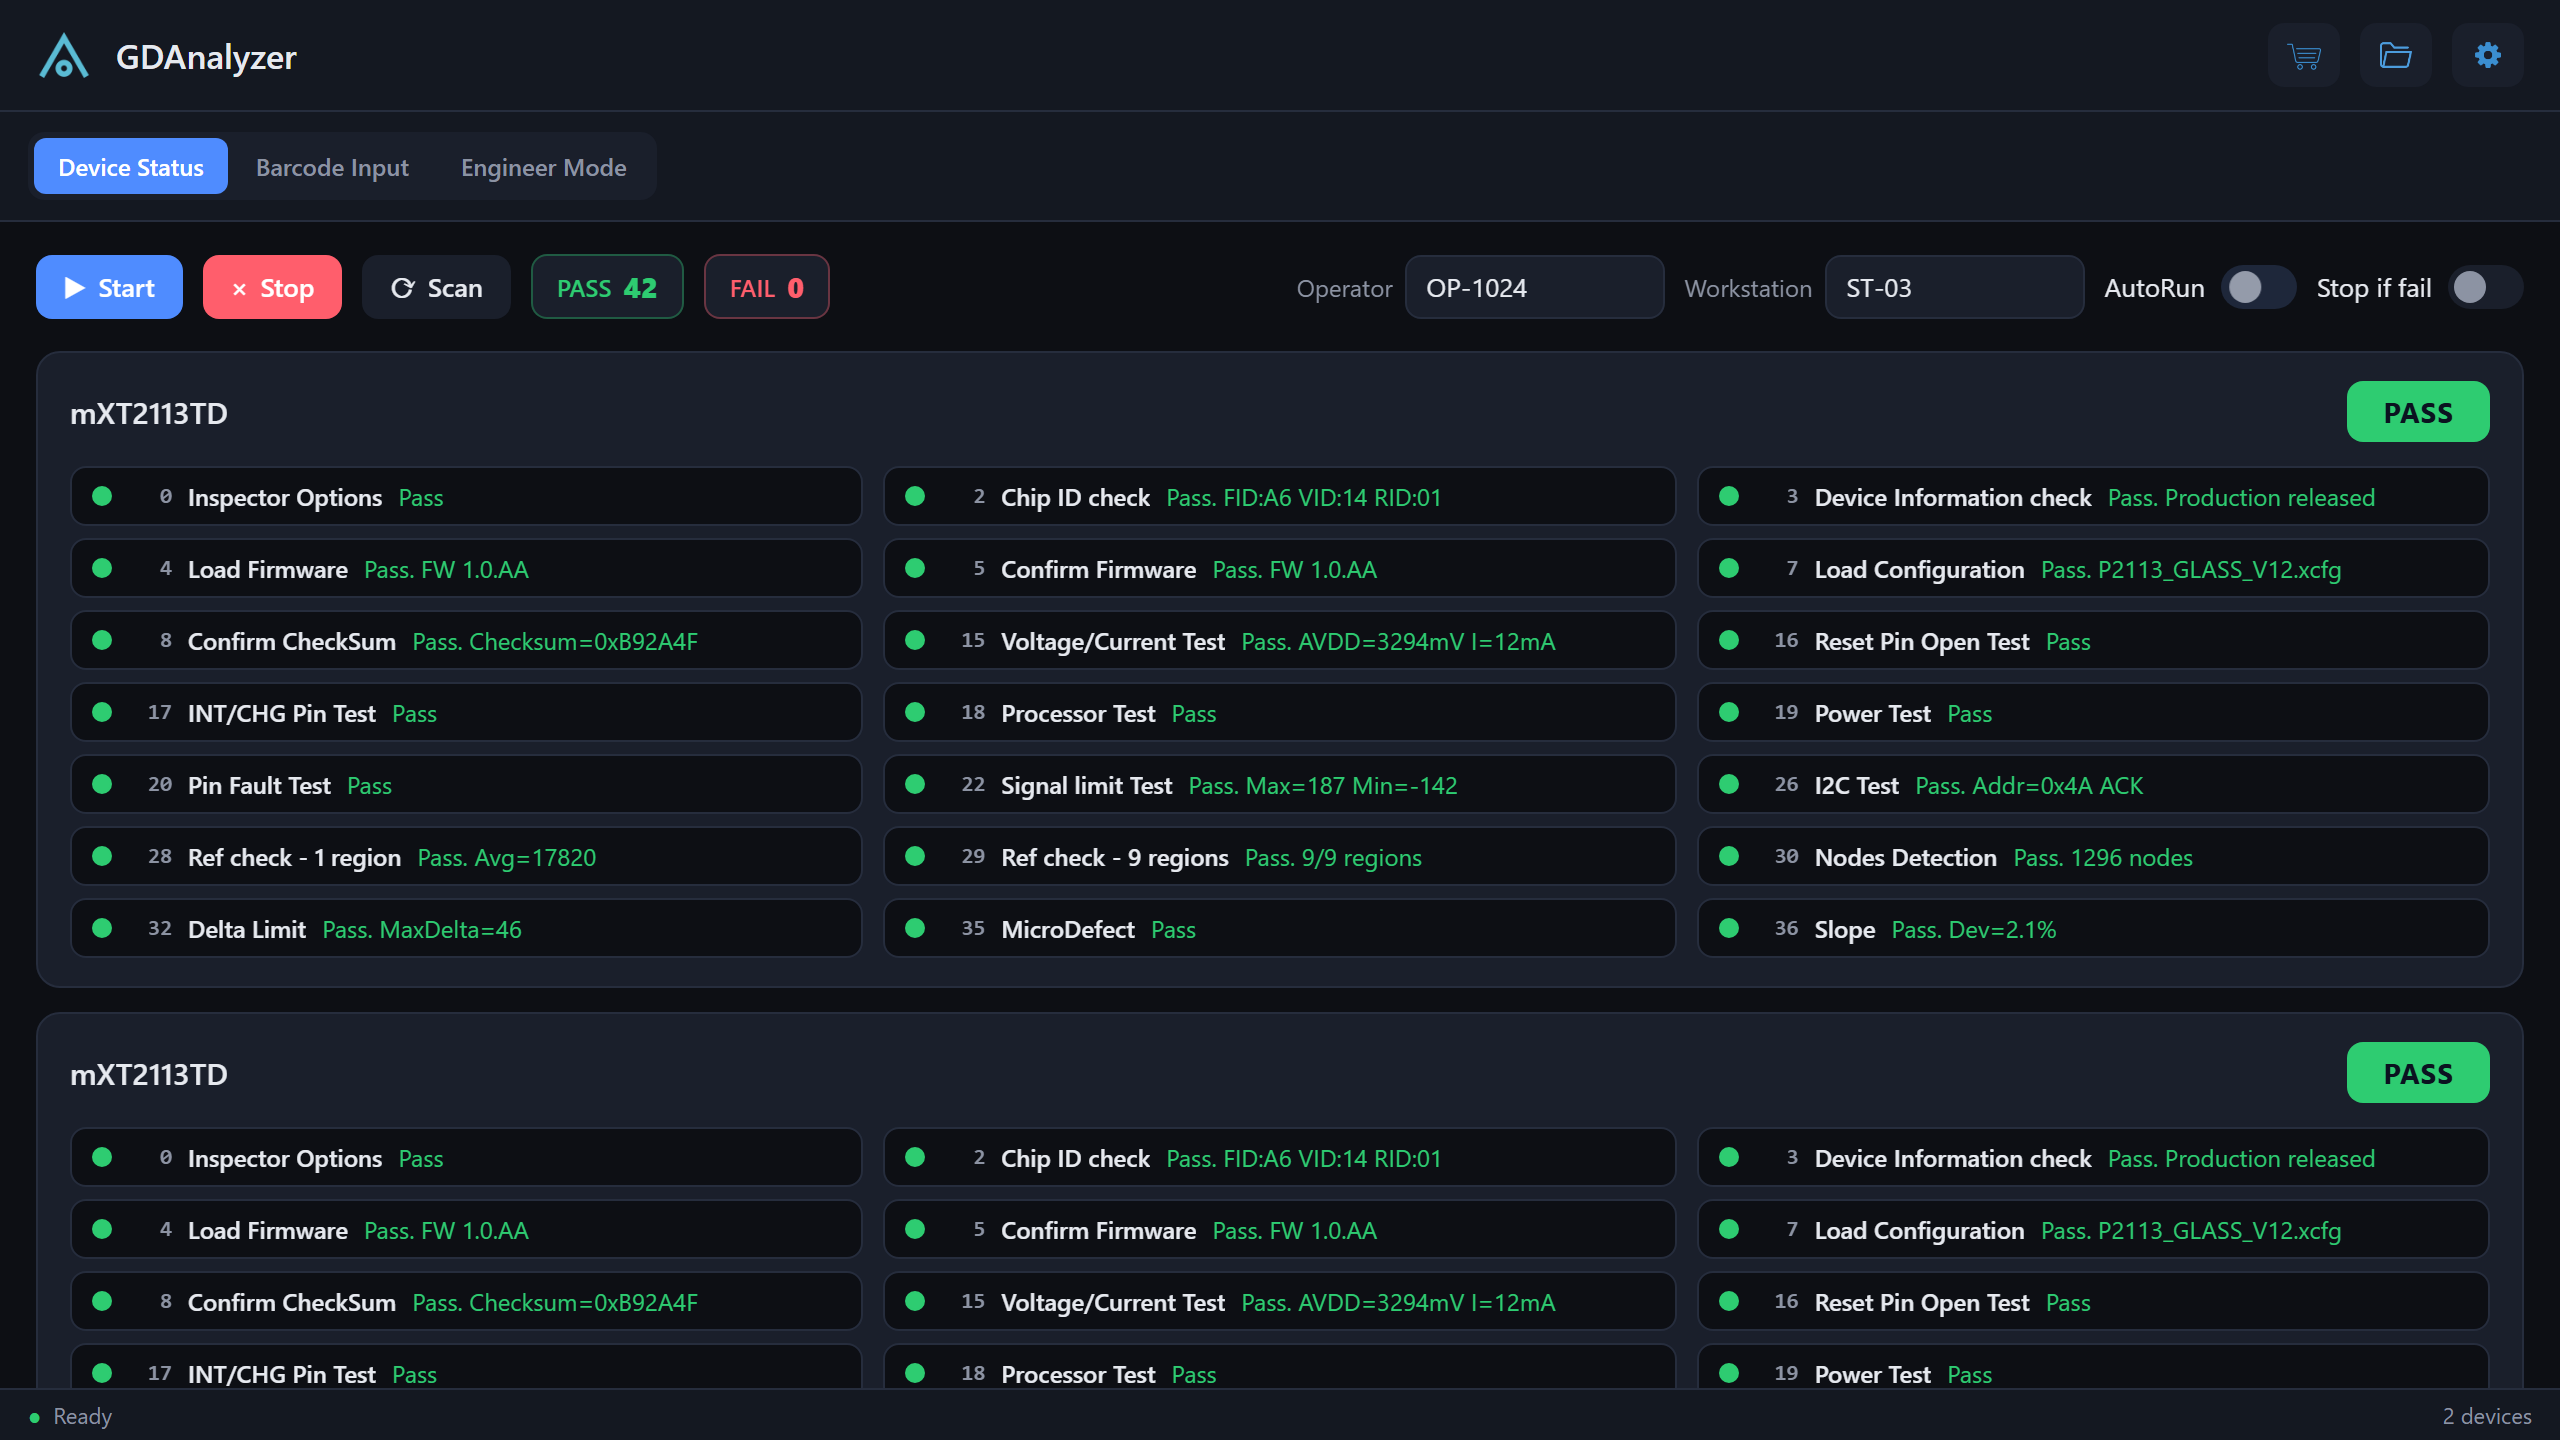
Day-to-day line operation is covered too: barcode input with scanner-friendly Enter/Tab flow and auto-start, multi-device parallel testing, automatic device re-scanning, PASS/FAIL counters, and a bilingual interface (English / Traditional Chinese).